Showing posts with label AC source. Show all posts

Monday, June 30, 2014

Doing Inrush Current Testing with the New AC6800 AC Sources

Hi everybody,

It is the last day of the month and therefore time for me to get my blog post out.  I want to build on Gary's latest post concerning the new Agilent/Keysight AC6800 AC Sources (Click Here).  One of the key features that Gary mentioned is inrush current testing.

My colleague Russ did a video on inrush current testing for the launch.  This gives you a little bit of perspective on why you want to do the testing and gives some good tips.


When you do inrush current testing, you typically want the highest value that the current has reached when the power is enabled.  The AC6800 has a peak hold current value that will store this value for you.  The unit stores the highest current value it has measured since that value was last cleared (either manually or from power on).  One key thing to remember is to always clear out the peak hold value before doing your measurement so that you know that your measurement is up to date.

The AC6800 can synchronize the enabling of the output to a user defined phase.  When you specify the phase, it will enable the output at that phase in the sine wave (anything from 0 to 360 degrees).  The combination of the peak hold measurement and this phase synchronization are what make this testing possible.  

I  did a video for the launch where I did a tour of the front panel, including a short description of how to do inrush current testing:


I also have a programming example on this topic.  Below is a snippet of a program that I wrote in VB.NET using Agilent VISA-COM:


That's about it for me this month.  Please let us know if you have any questions in the comments.  


Monday, June 23, 2014

New Agilent Basic AC Power Sources

I have mentioned several times before that I avoid posting product-only-focused material in this blog, but when we announce something new, it is appropriate for me to mention it here. Today, a press release went out about our new AC sources (click here to view). You may not realize it, but this press release marks the end of an era; these are the last power products Agilent Technologies will ever announce! Now don’t go all non-linear on me…..I’m sure we will continue to design and release new power products for decades to come. But as I mentioned in a previous post (click here), as of August 1, 2014, our products will be Keysight Technologies products and not Agilent Technologies products. So these new AC sources will be rebranded to Keysight in a few weeks, but because we are releasing them before the company name change is official, we have to release them as Agilent and not Keysight. Go figure….

Anyway, what are these new Agilent (soon to be Keysight) AC sources? Well, the model numbers will remain the same through the company name change and they are:

  • AC6801A (500 VA)
  • AC6802A (1000 VA)
  • AC6803A (2000 VA)
  • AC6804A (4000 VA)

This new AC6800 Series of basic AC sources compliments our previous line of more sophisticated AC sources (click here for those) by adding lower cost models and higher power. Here is what the new series looks like (of course, the big one is the 4 kVA model):
All four new AC6800 models share these features:
  • Output capabilities
    • Single-phase output
    • 2 ranges: 0 to 135 Vrms; 0  to 270 Vrms
    • 40 Hz to 500 Hz and DC
    • Sine wave (other waveforms with analog interface)
  • Measurement capabilities
    • Vac, Vdc, Vrms
    • Iac, Idc, Irms, Ipeak, Ipeak&hold, crest factor
    • Watts, VA, VAR, power factor
  • Other
    • Universal AC input
    • LAN (LXI-Core), USB, optional GPIB
    • Optional analog programming interface
The differences in the models are due to the output power ratings and can be summarized by looking at the output characteristics when producing an AC output or a DC output:

For a DC output, the graph above shows only the positive voltage and current quadrant (first quadrant). The output is equally capable of putting out negative voltage and negative current (the third quadrant) and the ratings are the same (except negative). These AC sources only source power; they cannot sink (absorb) power.

These AC sources do have one advanced feature: you can set the phase angle at which the output turns on. Coupled with the ability to measure peak current (and hold the peak current measurement), this is good for AC inrush current measurements.
To view the data sheet, click here.

So that’s the new line of basic AC power sources from Agilent and the last power products to be announced by Agilent. I wonder when the first Keysight power product announcement will be…..wouldn’t you like to know!?!?

Tuesday, April 29, 2014

Measurement of AC plus DC voltage

One of our AC source customers recently asked me to justify the reading on the front panel of one of our AC sources set to produce a sine wave with a DC offset. He had our 6812B AC Power Source/Analyzer set to a sine wave of 100 Vac (60 Hz) and added a DC offset of 50 Vdc. These AC sources can produce output voltages of up to 300 Vrms and DC voltages up to +/- 425 Vdc. With his settings of 100 Vac and 50 Vdc, the front panel meter was reading 111.79 V with the meter set to measure AC+DC. At first this seemed like an odd result to me, but then I realized that we are simply measuring the rms (root-mean-square) of the total waveform (AC plus DC) and that should be the square-root of the sum-of-the-squares of the individual rms values. This can be mathematically proven fairly easily. Since the AC source Vac is set in rms volts and the rms of DC is simply the DC voltage:


This works even if the DC value is set to -50 Vdc instead of +50 Vdc since the value is squared. And sure enough, when I set the AC source output to 100 Vac and -50 Vdc, the front panel measurement shows 111.82 as expected. The small variation in the measured value compared to the exact calculated value is due to the slight inaccuracies in both the output setting and measurement system.


So in summary, measurement of an rms waveform that consists of an AC signal plus a DC signal is the square-root of the sum-of-the-squares of the individual two values. It’s as simple as that!

Friday, February 28, 2014

R, L, C measurements with an AC source

I recently had a customer ask if there was a way to use one of our AC sources to determine whether the load connected to its output was capacitive or inductive. Agilent’s 6811B, 6812B, and 6813B AC power source/analyzers are all capable of making many different measurements, several of which can be used to calculate the impedance of the connected load. To determine the impedance, the simplest measurements to use are the amplitude and phase measurements of the applied sine wave voltage and resultant current. Agilent’s AC sources can measure harmonic content of the voltage and current, both amplitude and phase, up to the 50th harmonic. From these measurements, you can calculate the impedance of the R, L, or C connected to the AC source output.

I grabbed a few sample parts from our lab area to demonstrate these measurements. First, I used a power resistor that was about 49 ohms. I applied a sine wave of about 20 Vac at 1000 Hz (0 phase) and used the built-in measurement capability to measure about 0.4 Aac at a phase (angle) of very near 0 degrees (the measurement was -7.01E-2 = -0.071 degrees). Of course, 0 degrees of phase between the voltage and current means the sine waves are in phase and the load is resistive as expected. See Figure 1.

The next test I did was with an inductor. Connecting it to the output of the AC source and once again applying about 20 Vac at 1000 Hz from the AC source, using the built-in measurement capability, I measured about 0.129 Aac at a phase of -88.66 degrees. The phase measurement of nearly -90 degrees confirmed that the load on the AC source was an inductor and the magnitude could be calculated to be about 25 mH which is what I expected (I measured it using an Agilent LCR meter). The series resistance in the line cord, clip leads, and inductor wire itself (I did not use remote sense) accounted for the non-ideal phase of -88.66 degrees instead of the ideal phase of -90 degrees. And the R was calculated from the AC source measurements to be about 3.6 ohms and agreed with external verification. See Figure 2.

Finally, I connected a capacitor to the AC source output and applied about 10 Vac at 1000 Hz. The AC source measurement system showed 0.633 Aac at an angle of 87.47 degrees indicating a capacitor was across its output. From these measurements, the capacitance and series R were calculated to be 9.88 uF and 0.711 ohms, consistent with externally verified measurements. See Figure 3.
So you can see that it is possible to determine the impedance (resistance, capacitance, or inductance) of a device connected across the output of an AC source when the right measurement capabilities are built into the AC source, as they are with the Agilent AC sources. These highly capable products not only make measurements like this easy, they also can easily create a large variety of AC output stimulus waveforms.

Friday, January 24, 2014

Using Binary Data Transfers to Improve Your Test Throughput

From time to time I have shared here on “Watt’s Up?” a number of different ways the system DC power supply in your test set up impacts your test time, and recommendations on how to make significant improvements in the test throughput. Many of these previous posts are based on the first five of ten hints I’ve put together in a compendium entitled “10 Hints on Improving Throughput with your Power Supply” (click here for hints 1-5).

Oscilloscopes, data acquisition, and a variety of other test equipment are often used to capture and digitize waveforms and store large arrays of data during test, the data is then downloaded to a PC. These data arrays can be quite large, from thousands to millions of measurements. For long-term data logging the data files can be many gigabytes in size. These data files can take considerable time to transfer over an instrument bus, greatly impacting your test time.

Advanced system power supplies incorporating digitizing measurement systems to capture waveform measurements like inrush current are no different. This includes a number of system DC and AC power products we provide. Even though you usually have the choice of transferring data in ASCII format, one thing we recommend is instead transfer data in binary format. Binary data transmission requires fewer bytes reducing transfer time by a factor of two or more.


Further details about using binary mode data transfers can be found in hint 7 of another, earlier compendium we did, entitled “10 hints for using your power supply to decrease test time” (click here to access). Between these two compendiums of hints for improving your test throughput I expect you should be able find a few different ideas that will benefit your particular test situation!

Friday, February 17, 2012

The economics of recharging your toy helicopter

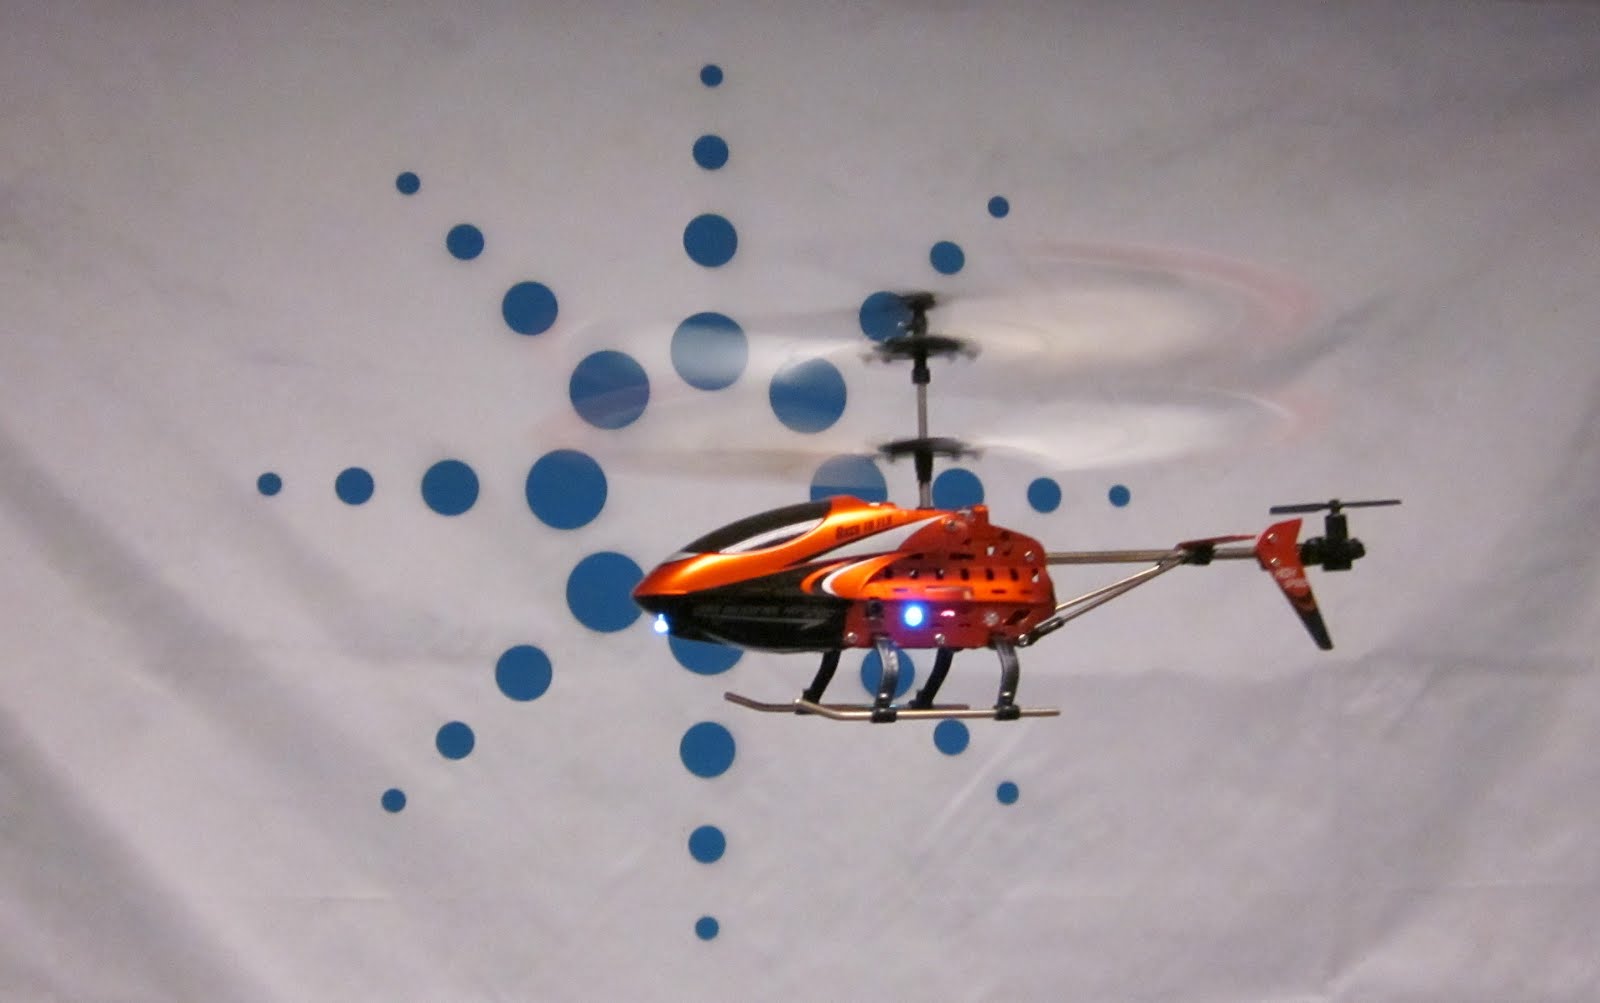
While on a business trip visiting customers in Taiwan back in December, I got a toy helicopter as a thank-you gift from one of my coworkers (thanks, Sharon!). This toy helicopter is fun to fly and is surprisingly stable in the air.


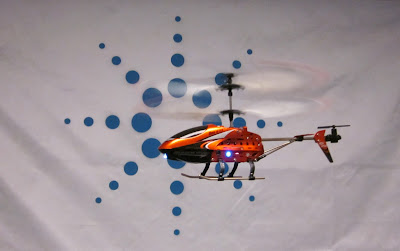
Flight time is about 7 minutes, and the battery recharge time is about 40 minutes. It can be recharged from a powered USB port by using a wire that came with the toy that has a USB connector on one end and the helicopter charging connector on the other end. Or, it can be recharged from the six AA alkaline batteries inside the handheld controller via a wire that exits from the controller. Thinking I did not want to prematurely drain the controller batteries, I typically used the USB charging method by using my iPad’s 10 W USB power adapter plugged into a wall outlet. So I got to thinking about which charging method was more economical: charging from a wall outlet or from the batteries. Luckily, I have test equipment at my disposal that can help me answer that question!


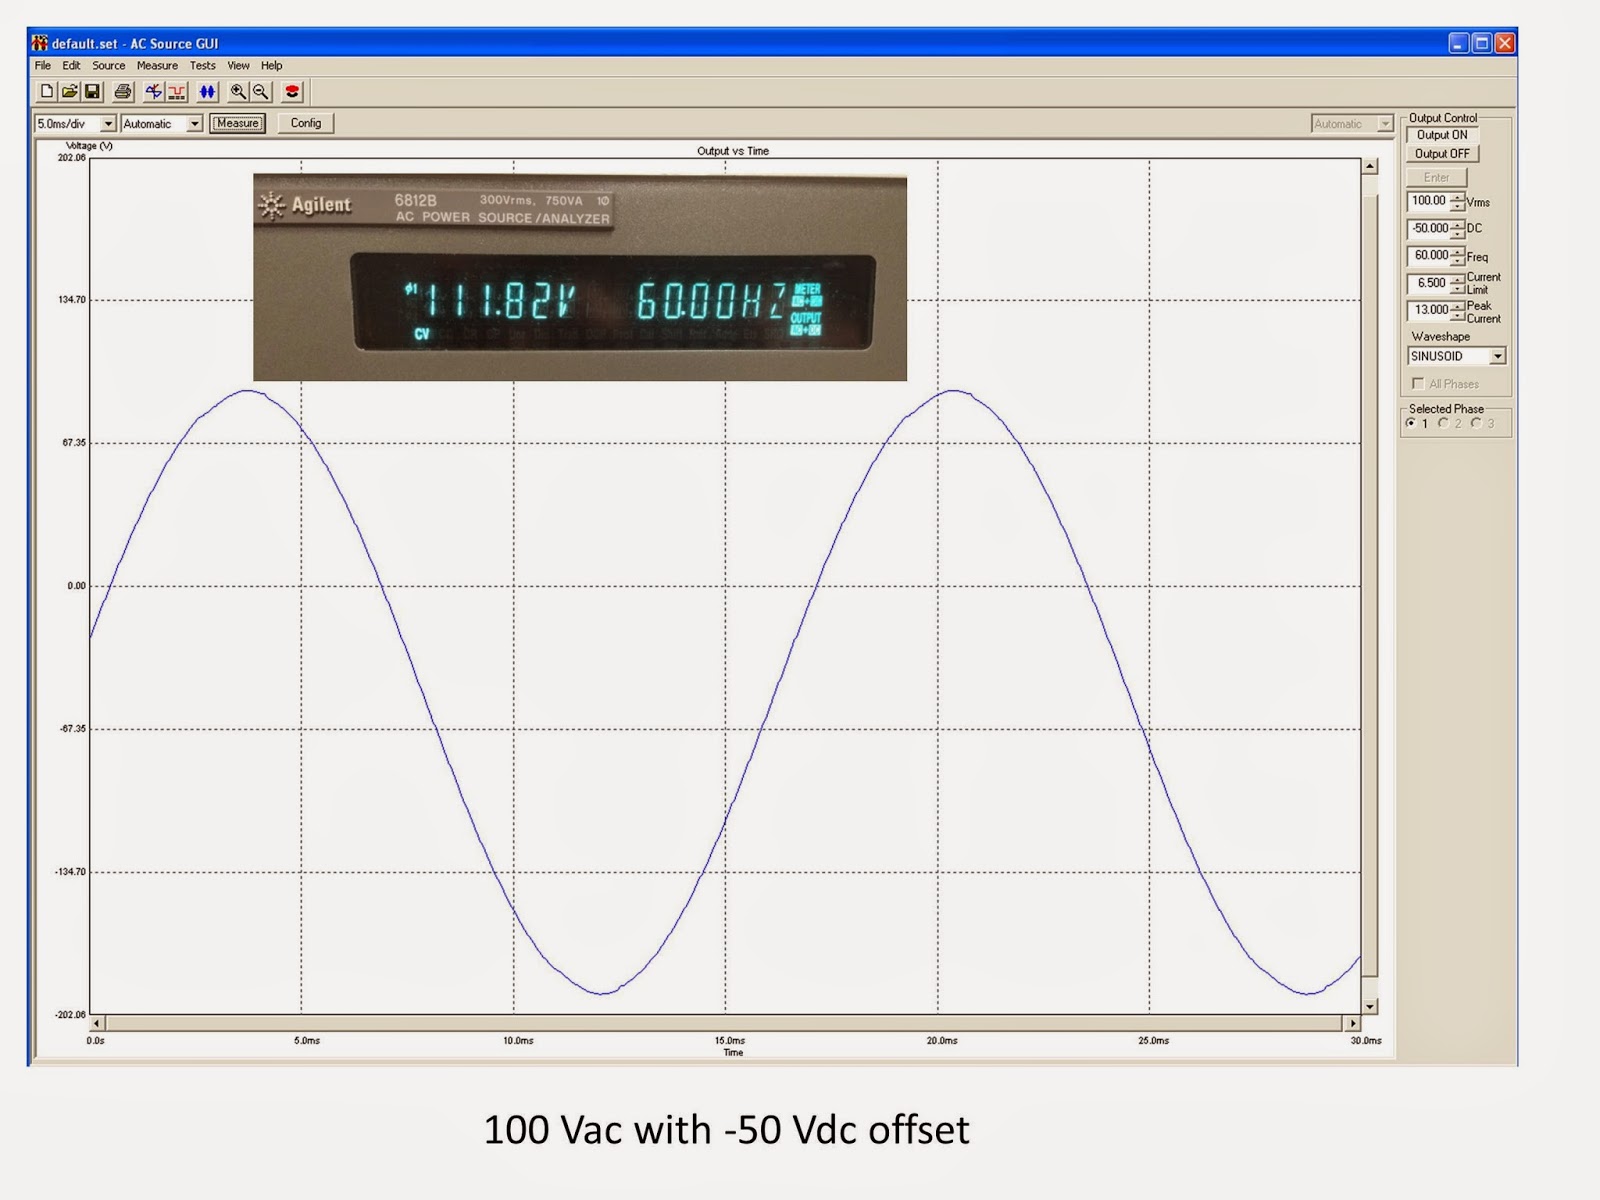
Recharging using AC power via USB power adapter
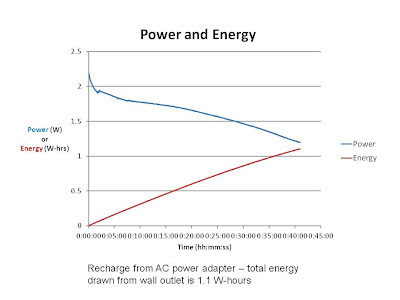
Using one of our Agilent 6812B AC sources, I captured the AC power used during a recharge cycle. I used the AC source GUI to take readings of power every second for the charge period and plotted it in a spreadsheet (graph shown below). I found that the power consumed started at about 2.2 W and ended at about 1.2 W roughly 41 minutes later. The energy used during this time was 1.1 W-hours. Where I live in New Jersey, the utility company charges about 15 cents per kilowatt-hour, so 1.1 W-hours of energy used to charge the helicopter costs fractions of a penny (0.0165 cents = US$ 0.000165). This is basically nothing!


Recharging using controller battery power
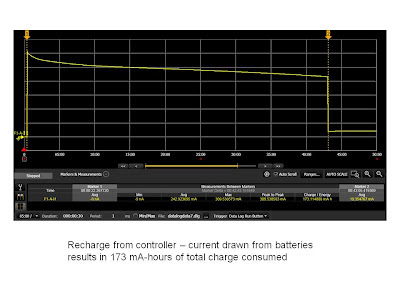
To analyze the current drawn from the controller batteries, I used one of our Agilent N6705B DC power analyzers with an N6781A SMU module installed. I ran the battery current path through the SMU set for Current Measure mode and used our 14585A Control and Analysis software. I captured the current drawn from the six AA batteries in the controller during the helicopter recharge cycle. These batteries are in series, so the same current flows through each of the six batteries and also through the SMU for my test.


For the recharge period (about 43 minutes using this method), the software shows the batteries provided 173 mA-hours of charge to the helicopter. A typical AA alkaline battery is rated for 2500 mA-hours, so that means I would get about 14 (= 2500/173) charge cycles from these six batteries. If you shop around for high-quality AA batteries, you might find them for as low as 25 cents per battery. Since the controller takes six of these, the battery cost for the controller is $1.50. If I can recharge the helicopter 14 times with $1.50 worth of batteries, each recharge cycle costs about 10.7 cents (= US$ 0.107). This is 650 times more expensive than using the AC power method, so I will continue using the wall outlet to recharge my toy helicopter! How about you?
Note that with the AC power recharge method, you pay for the kilowatt-hours you consume from your utility company. With the controller battery power method, you pay for the mA-hours you consume from your batteries. Consider this: if you choose the AC power method, you will save US$ 0.106835 per recharge cycle. That means after just 2.81 million recharge cycles, you will have saved enough money to buy yourself a real helicopter worth US$ 300,000, so you better get started now!