Showing posts with label power efficiency. Show all posts

Friday, October 30, 2015

New data logger solves the mystery of inconsistent efficiency readings

(Today’s post was written by another one of our experienced engineers, Bill Griffith. Thanks, Bill, for sharing your knowledge and this new feature with everyone!)

While measuring the efficiency of a small 12 Vdc to 115 Vac power inverter the readings fluctuated between 87.80 % and 88.70 % with a consistent load. To learn more about the efficiency, an IntegraVision Power Analyzer with its new data logging feature was used to capture efficiency over time.

The new data logger feature captures every numerical measurement from each channel over a period of time. With just two parameters to configure, the data logger is easy to use. The length of data logging can be as short as 1 second or as long as 365 days. The interval for recording data can be set as low as 50 ms to as high as 24 hours. If an interval of 200 ms or longer is selected, THD and efficiency measurements are also saved. All measurements are gapless, continuous whole cycle measurements.

Below is a graph of efficiency. As you can see the efficiency changes over time.

Efficiency is calculated from the output power divided by the input power. The data logger file contains the output and input power. Both are graphed below.


We can see the efficiency is fluctuating due to the input power. The inverter contains a small fan that turns on about every 10 seconds and increases the amount of power required.

If you are interested in seeing a video of the inverter being tested, watch this YouTube video.

A couple of final notes on using the data logger: the data logger file is a csv file; the rows are time stamped and hold the measurements for each interval. Each column is for a different measurement and a single channel can have over 30 measurements. The columns are labeled for each type of measurement and by channel. Check out the video mentioned above to see the data logger file and all of this in action.

Monday, February 24, 2014

How to test the efficiency of DC to DC converters, part 2 of 2

In part 1 of my posting on testing the efficiency of DC to DC converters (click here to review) I went over the test set up, the requirements for load sweep synchronized to the measurements, and details of the choice of the type and set up of the current load sweep itself. In this second part I will be describing details of the measurement set up, setting up the efficiency calculation, and results of the testing. This is based on using the N6705B DC Power Analyzer, N6782A SMUs, and 14585A software as a platform but a number of ideas can be applicable regardless of the platform.


Figure 1: Synchronized measurement and efficiency calculation set up

The synchronized measurement and efficiency calculation set up, and display of results are shown in Figure 1, taking note of the following details corresponding to the numbers in Figure 1:
  1. In the 14585A the data logging mode was selected to make and display the measurements. The oscilloscope mode could have just as easily been used but with a 10 second sweep the extra speed of sampling with the oscilloscope mode was not an advantage. A second thing about using the data logging mode is you can set the integration time period for each acquisition point. This can be used to advantage in averaging out noise and disturbances as needed for a smoother and more representative result. In this case an integration period of 50 milliseconds was used.
  2. To synchronize the measurements the data log measurement was set to trigger off the start of the load current sweep.
  3. Voltage, current, and power for both the input and output SMUs were selected to be measured and displayed. The input and output power are needed for the efficiency calculation.
  4. The measurements were set to seamless ranging. In this way the appropriate measurement range for at any given point was used as the loading swept from zero to full load.
  5. A formula trace was created to calculate and display the efficiency in %. Note that the negative of the ratio of output power to input power was used. This is because the SMU acting as a load is sinking current and so both its current and power readings are negative.


With all of this completed really all that is left to do is first start the data logging measurement with the start button. It will be “armed” and waiting from a trigger signal from the current load sweep ARB that had been set up. All that is now left to do is press the ARB start button. Figure 2 is a display of all the results after the sweep is completed.


Figure 2: DC to DC Converter efficiency test results

All the input and output voltage, current, and power measurements, and efficiency calculation (in pink) are display, but it can be uncluttered a bit by turning off the voltages and currents traces being displayed and just leave the power and efficiency traces displayed. This happened to be special DC to DC converter designed to give exceptionally high efficiency even down to near zero load, which can be seen from the graph. It’s interesting to note peak efficiency occurred at around 60% of full load and then ohmic losses start becoming more significant.

And that basically sums it all up for performing an efficiency test on a DC to DC converter!

Thursday, February 20, 2014

How to test the efficiency of DC to DC converters, part 1 of 2

I periodically get asked to provide recommendations and guidance on testing the efficiency of small DC to DC voltage converters. Regardless of the size of the converter, a DC source is needed to provide input power to the converter under constant voltage, while an electronic load is needed to draw power from the output, usually under constant current loading. The load current needs to be swept from zero to the full load current capability of the DC to DC converter while input power (input voltage times input current) and output power (output voltage times output current) are recorded. The efficiency is then the ratio of power out to power in, most often expressed in a percentage. An illustration of this is shown in Figure 1. In addition to sourcing and sinking power, precision current and voltage measurement on both the input and output, synchronized to the sweeping of the load current is needed.


Figure 1: DC to DC converter efficiency test set up

One challenge for small DC to DC voltage converters is finding a suitable electronic load that will operate at the low output voltages and down to zero load currents, needed for testing their efficiency over their range, from no load to full load output power. It turns out in practice many source measure units (SMUs) will serve well as a DC electronic load for testing, as they will sink current as well as source current.

Perhaps the most optimum choice from us is to use two of our N6782A 2-quadrant SMU modules installed in our N6705B DC Power Analyzer mainframe, using the 14585A software to control the set up and display the results.  This is a rather flexible platform intended for a variety of whatever application one can come up with for the most part. With a little ingenuity it can be quickly configured to perform an efficiency test of small DC to DC converters, swept from no load to full load operation. This is good for converters of 20 watts of power or less and within a certain range of voltage, as the N6782A can source or sink up to 6 V and 3 A or 20 V and 1 A, depending on which range it is set to. One of the N6782A operates as a DC voltage source to power the DUT and the second is operated as a DC current load to draw power from the DUT. A nice thing about the N6782A is it provides excellent performance operated either as a DC source or load, and operated either in constant voltage or constant current.

An excellent video of this set up testing a DC to DC converter was created by a colleague here, which you can review by clicking on the following link: “DC to DC converter efficiency test”.

The video does an excellent job covering a lot of the details. However, if you are interested in testing DC to DC converters using this set up I have a few more details to share here about it which should help you further along with setting it up and running it.

First, the two N6782A SMUs were set up for initial operating conditions. The N6782A providing DC power in was set up as a voltage source at the desired input voltage level and the second N6782A was set to constant current load operation with minimum (near zero) loading current.

Note that the 14585A software does not directly sweep the load current along the horizontal axis. The horizontal axis is time. That is why a time-based current sweep was created in the arbitrary waveform (ARB) section of the 14585A. In that way any point on the horizontal time axis correlates to a certain current load level being drawn from the output of the DUT. The ARB of course was set to run once, not repetitively. The 14585A ARB set up is shown in Figure 2.


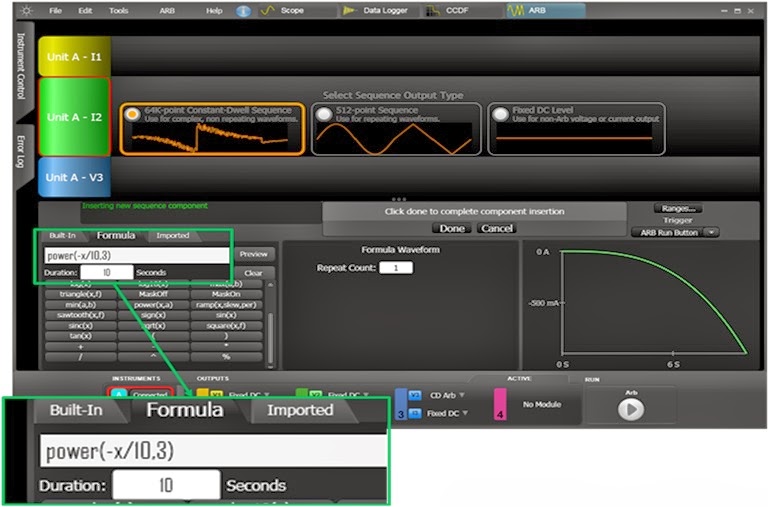
Figure 2: Load current sweep ARB set up in 14585A software

This ARB sweep requires a little explanation.  While there are a number of pre-defined ARBs, and they can be used, an x3 power formula was chosen to be used instead. This provided a gradually increasing load sweep that allowed greater resolution of this data and display at light loads, where efficiency more quickly changes. As can be seen, the duration of the sweep, parameter x, was set to 10 seconds. As a full load current needed to be -1 A, using the actual formula (-x/10)3  gave us a gradually increasing load current sweep that topped out at -1A after 10 seconds of duration. The choice of 10 seconds was arbitrary. It only provided an easy way to watch the sweep on the 14585A graphing as it progressed. Finally, a short (0.1 second) pre-defined linear ramp ARB was added as a second part of the ARB sequence, to bring the load current back to initial, near zero, load conditions after the sweep was completed. This is shown in Figure 3.


Figure 3: Second part of ARB sweep to bring DUT load current back to initial conditions


I hope this gives you a number of insights about creative ways you can make use of the ARB. As there is a good amount of subtle details on how to go about making and displaying the measurements I’ll be sharing that in a second part coming up shortly, so keep on the outlook!

Thursday, May 23, 2013

How much AC power do you need to support your DC output?

You may know the maximum rated output power of your DC power supply, but do you know how much AC input power is needed to support the DC output of the power supply? Probably not. Since no power supply is 100% efficient, you know you will need more input power than the output power produced, but how much more? The answer depends primarily on the efficiency of the power supply (since efficiency here is power out divided by power in).There are 2 main sources of losses contributing to the efficiency, or perhaps I should say “inefficiency”, of a power supply:

  1. Overhead power loss– this is the power consumed by the power supply that is not directly related to the output power conversion. It is the amount of power consumed by the internal circuits that are needed just to provide the basic internal functions of the power supply, such as front panel display control, internal bias supplies, cooling fans, and microprocessor control. This power is dissipated as heat inside the power supply and is therefore not available to flow to the output. Some of this power is consumed even when the output is providing no power.
  2. Power conversion loss – this is the power lost in the power conversion circuitry. All of the output power flows through the power conversion circuitry, but as it does so, some heat is generated. The power lost as heat is not available to flow to the output.

A power supply’s efficiency is typically specified at the maximum output power point and includes losses associated with both the overhead power and power conversion circuitry. Most power supply vendors will publish the maximum expected AC input current, watts, and/or volt-amperes for their products so you should be able to get this information from the vendor’s documentation. But let’s consider an example based just on the output power rating and efficiency.

A power supply rated for 2000 W of output power with an efficiency of 80% will require 2000 W / 0.8 = 2500 W of AC input power. In the United States, the standard AC line voltage is 120 Vac. At a nominal voltage of 120 Vac, the AC input current would be 2500 W / 120 Vac = 20.8 Aac which is more than a standard outlet can provide (15 A maximum is a typical rating for an outlet). If the AC input line voltage sags a little making it lower, the input current would be even higher! To accommodate the AC input of this 2000 W power supply, there are several alternatives:

  1. Use a less-common receptacle (outlet) and plug rated for more than 20 A.
  2. Have an electrician hard-wire the AC input connection to the AC mains ensuring the wires and AC mains branch circuit can handle the higher current (no outlet would be used).
  3. If the power supply is rated for it, power the power supply from a higher AC input voltage, such as 208 Vac or 240 Vac to reduce the current required. This solution will also require a less-common receptacle and plug (middle receptacles in photo).

Many very high-power supplies (a few kW and above) require a 3-phase AC input voltage to accommodate the larger amount of output power (orange receptacle shown at top of photo).


One of my colleagues, Bob Zollo, wrote an article entitled “Do You Have Enough AC For Your DC?” that appeared in Electronic Design on May 7, 2013. For some additional information about this topic, take a look at the article:

http://electronicdesign.com/test-amp-measurement/do-you-have-enough-ac-your-dc