Wednesday, October 30, 2013

Protect your DUT from over-current in more ways than one

Last month, I posted about one of our new families of products: the N6900/N7900 Series 1- and 2-kW Advanced Power System (APS) DC Power Supplies (click here). I typically like to post about more general power topics rather than focus on specific Agilent products, but this product has some really interesting features from which you can benefit. After 33 years of working on power here, there aren’t too many new products that get me excited, but this is one of them! So here is a story about an application for it.

Earlier this month, I visited one of our customers that had a device under test (DUT) whose input was sensitive to too much current. That is typically not a difficult issue to protect against using Agilent power supplies with over-current protection (OCP). Set the current limit to a value that you don’t want to exceed, turn on OCP, and the power supply output will go into protect (turn off) when the current limit value is reached. Simple enough! But this customer had an additional requirement. In addition to an OCP value as just described, he also wanted to shut down the output if the current exceeded a lower current for more than a specified amount of time. So he wanted the power supply output to go into protect (turn off) if either of the following conditions occurred on his DUT (I changed this example to protect his information):

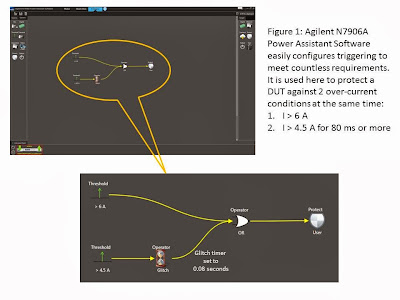
       1.  DUT input current exceeds 6 A for any amount of time, or
       2.  DUT input current exceeds 4.5 A for 80 ms

To be honest, at the time of the visit, I wasn’t sure if our new product could do this. The product is so new and so feature-rich that I am not yet familiar with all of its capabilities. But when I returned to my office, I set it up and found it was very easy to do! Here is the solution:

I used the advanced signal routing and logical trigger expressions built into our N7952A APS to setup both requirements. I could have sent SCPI commands to setup the same trigger configuration, but our free Power Assistant Software (N7906A) made this even easier. Figure 1 shows the software with the configuration.


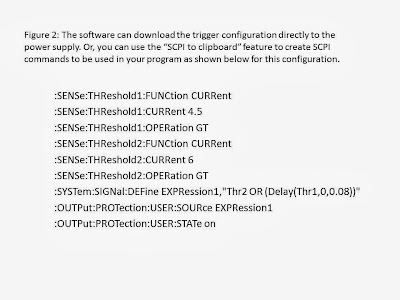
If, after creating the configuration, I want all of the SCPI commands that correspond to it for a program, I could use the software feature “SCPI to clipboard” that creates them from the configuration. See Figure 2.


Take a look at this feature in action. Figure 3 shows a scope trace of the current waveform. As you can see, currents that are less than 4.5 A do not trip the protection. And currents above 4.5 A for less than 80 ms (and below 6 A) also do not trip the protection. But as soon as the current exceeds 4.5 A for 80 ms (and remains below 6 A), the protection tripped – the output shut off causing the current to go to zero amps.


This is just one example of how versatile the N6900/N7900 APS power supplies are. For more information about how these advanced power systems can help you in your power application, please use this link: www.agilent.com/find/aps. To explore this advanced signal routing and logical trigger expressions feature even more, take a look at a post from one of my collegues: http://gpete-neil.blogspot.com/2013/10/protecting-your-dut-during-test-with.html
Thursday, October 17, 2013

Quickly Measure a High Brightness LED’s (HBLED) Forward Electrical Characteristics

It’s not hard to notice (or extremely hard not to notice!) how high brightness LEDs, or HBLEDs, are quickly becoming commonplace all around us in our daily lives. LEDs are no longer relegated to being an indicator light on a display panel. HBLEDs have drastically ratcheted up their output to become sources for illumination.  More and more autos use them for their tail and brake lights. It’s easy to see the “instant on” they have when the auto in front of you hits its brakes, not to mention the deep purity of color they have in comparison to the incandescent predecessors.  They are also turning up in the headlights, the traffic lights, even high power street and parking lot illumination lights, and in countless other places. A lot of testing, characterization, and development work has, and continues to take place, to achieve this level of performance from HBLEDs. This includes making careful measurements of electrical power being provided and the corresponding luminous efficacy outputted, in order to assess its performance.

In my title above I am using the term “quickly” for two reasons in my posting today. First, it is important when trying to capture the forward characteristics of an HBLED that it is performed in a minimum amount of time in order to minimize temperature change due to self-heating.  The temperature an HBLED is running at has in impact on its performance. Minimizing the amount of temperature change improves accuracy of test results in determining the performance of the HBLED, for a given operating temperature. My second reason for using quickly is providing a means to make these HBLED measurements with just a little time and effort.

It turned out using the N6784A four-quadrant SMU module in an N6705B DC power analyzer mainframe worked out really well on both counts of quickly. This set up is depicted in Figure 1.


Figure 1: HBLED test characterization set up

While the N6784A is an extremely fast voltage source it is even a faster current source. With current rise and fall times of just a few microseconds was a simple matter to generate sub-millisecond-long high amplitude pulses of current with fast settling edges to provide the necessary stimulus for performing the forward electrical characterization of the HBLED. This allowed testing to take place in minimum time and avoid significant heating of the HBLED die.

One of the outcomes of the testing is shown in Figure 2, displayed graphically by the 14585A software.  Here a ramped current pulse was used instead of a flat top pulse. The HBLED’s voltage and current were simultaneously digitized as the current was ramped up. This gave a way of characterizing the HBLED’s forward voltage drop for all levels of drive current, from zero to maximum.


Figure 2: HBLED forward characterization results
The N6705B DC Power Analyzer mainframe and 14585A companion software made quick work of the setup, testing, and display of results.  A ramp waveform from the library of pre-defined ARBs was selected and used to generate the current ramp. In this instance it was set to ramp up to 1.2 amps in 1 millisecond. The oscilloscope mode was used to set up the simultaneous capture of voltage and current, synchronized to the current ramp stimulus. As voltage and current were captured it is also a simple matter to display the power, being the point-by-point product of the voltage and current. The electrical power in can then be correlated with a light output measurement on the HBLED for evaluating its performance.

Not only is this setup able to measure the HBLED’s forward characteristics, as the N6784A can source negative voltage and measure down to nanoamp levels it can quickly test the HBLED’s reverse leakage characteristics as well.

Wednesday, October 9, 2013

Using the power supply status subsystem to improve your test throughput

Continuing on my throughput theme here, one recommendation is to take advantage of the power supply’s status subsystem. Some power supply operations take notably longer than most to complete than others. Two notable examples:
  • Initializing a triggered measurement
  • Initializing a triggered output transient or output list event

When developing programs you can include long, fixed wait statements to make certain these operations have completed before proceeding. However, this can easily add many tens of milliseconds or more of unnecessary waiting, increasing overall test time.  A better way is to take advantage of the DC power supply’s status subsystem features that eliminate unnecessary waiting for these operations.

Triggered measurement and output sourcing events can substantially speed up testing by providing actions tightly synchronized with other test activities. But they do have some up-front set up overhead time needed for initializing them. Instead of using a fixed programming delay following an initialization operation it is better to take advantage of the Operation Status Group register in the status subsystem, which is illustrated in Figure 1.


Figure 1: Agilent N6700 series DC power system operation status group

The “WTG meas” bit (#3) or “WTG trans bit (#4) in the condition register can be monitored with a loop in the test program to see when they turn true. At the moment the measurement or output sourcing event is initiated and ready for a trigger the test program will then proceed with its execution without incurring any unnecessary additional waiting. This saves a considerable amount of time as illustrated in Figure 2.


Figure 2: Operation-complete wait time distribution

Instead of waiting for the full worst-case each and every time, the wait is now just the actual time. When repeated over and over for all DUTs being tested, the net result is the average of the actual wait time, which in most cases is just a small fraction of the worst case time! The net result can be many tens of milliseconds test time savings, making an improvement in test throughput.

The first five hints of my compendium “10 Hints for Improving Throughput with your Power Supply” can be viewed here: (click here to access).  For those reading our “Watt’s Up?” blog here are getting the opportunity to preview one of the remaining 5 hints yet to be released!

Monday, September 30, 2013

New Agilent Advanced Power System: More on High-Power!

Last week, I announced two new families of high-power system DC power supplies from Agilent Technologies:
  • N6900/N7900 Series 1- and 2-kW Advanced Power System (APS) DC Power Supplies
  • N8900 Series 5-, 10-, and 15-kW Autoranging DC Power Supplies
Here is the press release on these two new families:

In my post last week, I concentrated on the N8900 Series of autoranging power supplies. Those are basic DC power supplies with outputs up to 15 kW (can be paralleled to 100 kW and more). Today, I am focusing on the N6900/N7900 Series of Advanced Power System DC Power Supplies. These power supplies really do live up to their “Advanced Power System” label. I’ve been working here on power products since 1980 and have supported several feature-rich product families in that time: most notable were our AC source products (6811B, 6812B, and 6813B) and more recently, our battery drain analysis source/measure units (N6705B with N6781A). The new N6900/N7900 Advanced Power System rivals those products for rich features and quite honestly, just like our marketing slogan says, they really should help you “overcome your toughest power test challenges”. Why? Read on…

First the basics:
  • There are ten 1 kW models each in a 1U package
  • There are fourteen 2 kW models each in a 2U package
  • Rated output voltages range from 9 V to 160 V
  • Rated output currents range from 12.5 A to 200 A
  • Outputs can be paralleled up to 10 kW
Here is what these products look like:


Now for a few details. There are two performance levels:
  • N6900 Series is designed for ATE applications where high performance is critical
  • N7900 Series is designed for ATE applications where high-speed dynamic sourcing and measurement is needed
Both performance levels have advanced power features including:

   Sourcing
  • Precision voltage and current programming (N6900 is 14-bit; N7900 is 16-bit)
  • Programmable output resistance
  • Current sinking up to 10% of rated current (up to 100% with added N7909A power dissipator)
   Measurement
  • 18-bit voltage and current measurements
  • Power measurements
  • Amp-Hour and Watt-Hour measurements

The higher performance N7900 products add more features to the above:

    Sourcing
  • Precision 16-bit voltage and current programming (N6900 is 14-bit)
  • Output lists to quickly step through voltage or current levels
  • Arbitrary waveform generation
    Measurement
  • Low current measurement range
  • Seamless ranging for dynamic current measurements
  • Adjustable sample rate
  • Measurement array readback
  • External data logging

And even more capabilities:
  • Extended current measurement range that measures 2.25 x higher than the rated current
  • Sampling up to 200 kS/s
  • Extensive triggering capability
  • Extensive protection features such as open sense lead detect, over- and under-voltage and current, and over-temperature
  • And my personal favorite: you can track power events by adding a black box recorder (N7908A). The N7908A Black Box Recorder is a user-installable option that performs continuous background logging of output voltage, current, power, and system status to its own dedicated mass storage device. Features of this option include:
    • Automatic logging starts when the power supply is turned on
    • Logs in a circular buffer of about 380 MB
    • Select one record every 10 ms (24 hours of logging) or one record every 100 ms (10 days of logging).
    • Each record saves the average, maximum, and minimum  values for voltage, current, and power in addition to power supply status bits and events
    • Logged data is preserved after a power cycle. A time-stamped event is logged each time power is turned on.

The black box recorder is pretty cool, no? If you have a mission critical power application, this option is a must to keep track of any power related events that might affect your device under test.

One of my colleagues, Neil Forcier, posted about these products on his GPETE blog earlier this month. Here is a link to that post: http://gpete-neil.blogspot.com/2013/09/the-new-advanced-power-system-designed.html

For more detailed information, take a look at the datasheet: http://cp.literature.agilent.com/litweb/pdf/5991-2698EN.pdf

The datasheet contains some fantastic details about the products including 9 tests challenges that are directly addressed by these powerful products. In fact, you can read about each of the 9 test challenges here: www.agilent.com/find/TestChallenges

With all of these advanced features built into this family of products, I think you can now appreciate why we called it the Advanced Power System!

Friday, September 27, 2013

New Agilent Autoranging Power Supplies provide Higher Power

I have stated before that I avoid posting product-only-focused material in this blog since our intention here is to educate about all-things-power rather than to (directly) promote our products. But when we (Agilent….for now…) come out with new power products, I think it is appropriate for me to announce them here. The last time I did this was back on January 23, 2012 in this post:


Coincidentally, those products were autoranging power supplies just like some of the power products we just introduced! Earlier this month, Agilent announced two new families of high-power system power supplies with this press release:

http://www.agilent.com/about/newsroom/presrel/2013/04sep-em13103.html

The two new families are the:
·         N6900/N7900 Series 1- and 2-kW Advanced Power System (APS) DC Power Supplies
·         N8900 Series 5-, 10-, and 15-kW Autoranging DC Power Supplies

Today I will focus on the higher power series, the N8900. Next week, I’ll post about the N6900/N7900 series.

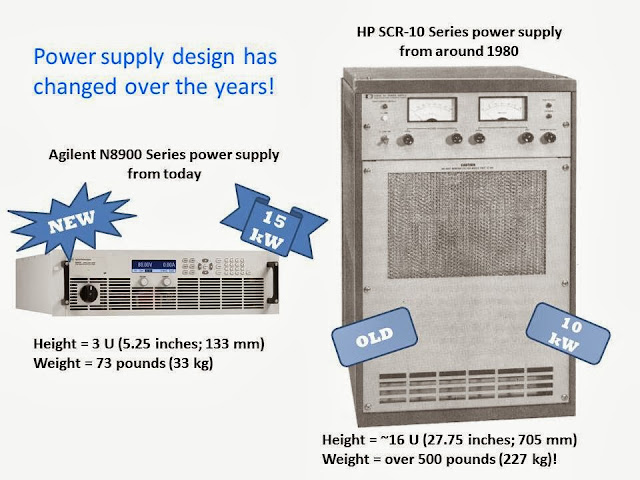
What is particularly exciting for us about the N8900 series of products is that it is the highest power level we have ever provided. I’ve been working here at Agilent with power products since 1980 (we were Hewlett-Packard back then and will soon get yet another new name), and until now, the highest-power power supply we offered was the HP SCR-10 Series at 10 kW. This product was discontinued many years ago. Now the new N8900 series has 5, 10, and 15 kW in a single model and outputs can be paralleled for 100 kW or more! Now that’s a lot of power!!

Back when I started, 10 kW came in a much larger package and weighed over 500 lb (227 kg)! Today, we can get 50% more power (15 kW total) in an 80% smaller package (3 U vs 16 U) that is 85% lighter (73 lb vs 500 lb). See the figure below.

The new N8900 series offers 14 different voltage, current, and power combinations with output voltages up to 1500 V and output currents up to 510 A. Outputs can be put in parallel for 100 kW or more. These are basic power supplies, but have autoranging output characteristics so you get more voltage and current combinations from a single output than if you used a power supply with a rectangular output characteristic. See the figure below.


For more information about autorangers and output characteristics, see the post I mentioned earlier (or click here.)

We also created a video introducing the N8900 series (I do a cameo toward the end…can you pick me out?).


These basic power supplies will be used in many different high-power applications, such as hybrid-electric vehicle test and photo-voltaic inverter test. So if you need a basic high-power power supply, check out the Agilent N8900 Series. And don’t hesitate to ask me a question about the product or its suitability for your application.

Thursday, September 12, 2013

How fundamental features of power supplies impact your test throughput – Part 2

In part 1 of” How fundamental features of DC power supplies impact your test throughput” (click here to access) I shared definitions of some of the fundamental power supply features that impact test throughput, including:
  • Command processing time
  • Up-programming response time
  • Down-programming response time


Another fundamental DC power supply feature impacting test throughput is its measurement time. There are actually two aspects to a DC power supply’s measurement time as depicted in Figure 1:
  • Measurement settling time
  • Measurement integration time


Figure 1: DC power supply measurement time

A good indicator of a DC power supply having a high performance measurement system is having programmable measurement integration time, or aperture time, often programmed in power line cycles (PLCs).  One reason for having a programmable integration time is for minimizing any 50 or 60 Hz AC line ripple getting into the DC measurement, by setting the time one or more multiples of a PLC.  Setting the time to 1 PLC provides good ripple rejection with relatively good throughput. When AC line ripple is not an issue the integration time can be set even smaller than 1 PLC, further reducing measurement time. When the DC power supply has a programmable measurement integration time it will no doubt also have a fast-responding measurement system as well, typically just milliseconds, to complement the higher achievable throughput with programmable measurement integration time.

In comparison basic DC power supplies commonly use a 100 millisecond fixed integration time to support AC ripple rejection for both 50 and 60 Hz line frequencies. They also have low bandwidth, slow-responding measurement systems, which can long time to settle after any step change in loading, before a valid measurement can be taken.

We have just introduced our Advanced Power System (APS) DC power supplies. This is a family of high-performance, high power (1 and 2 kW) DC power supplies designed to address the most demanding test challenges. These fundamental throughput-related features for APS are typically more than two orders of magnitude faster compared to more basic-performance DC power supplies, providing much better throughput in manufacturing test. A colleague of mine recently posted details of their introduction on his “General Purpose Electronic Test Equipment (GEPETE)” blog (click here to access) which I believe you will find of interest. Included in this introduction is a link on throughput that takes you to a series of application briefs I have written that go into more detail on improving test throughput with the DC power supply, which you may find very useful.


So how much test throughput improvement might you expect to see by switching from a basic-performance DC source to a high-performance DC source? Well, it really depends on how much the testing makes use of the DC power supply. If it only uses the power supply to provide a fixed DC bias to the device under test (DUT) that never changes for the duration of the test then it will not make a significant difference. More often than not however, a DUT is tested at several bias voltages with several current drain measurements taken for the various bias voltage settings and DUT operating modes. This can add up to a considerable amount of test time. In this case a high-performance DC power supply can more than pay for itself many times over due to improved test throughput.  To get an idea of the kind of difference a high-performance DC power supply can make I set up a representative benchmark test It compares the throughput performance one of our new APS DC power supplies to that of a more basic-performance power supply.  If you are interested in finding out how much difference it made, I made a video of this benchmark testing, entitled “Increasing Test Throughput with Advanced Power System” (click here to access). All I am going to say here is it is an impressive difference but you will need to watch the video to see how much difference!

Friday, September 6, 2013

How fundamental features of power supplies impact your test throughput – Part 1

When it comes to manufacturing of electronic products, reducing test time to improve throughput is virtually always a top priority, because “time is money” as the old saying goes! Usually most all of the attention may be placed on reducing the test time of the banner aspects of the product, such as the RF performance of a wireless device, for example. However, the choice of the DC system power supply can also have a huge impact on your test time and throughput during manufacturing. You may find the lowest cost, more basic-performance DC power supply that meets your immediate needs end up costing you the difference in price many, many times over of that of a higher-performance DC power supply having better throughput performance in the long run!

The DC power supply can incorporate a number of advanced features, such as elaborate triggering and sequencing systems, which will allow you restructure your testing to optimize throughput. However, even fundamental throughput-related features of the power supply can also have a large impact on your test time, including:
  • Command processing time
  • Output up-programming time
  • Output down-programming time
  • Measurement time

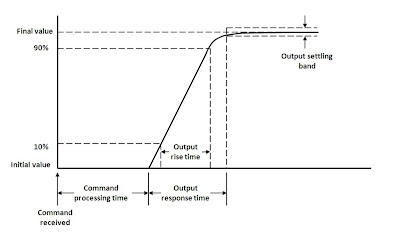
Figure 1 illustrates what the command processing and up-programming times are for a DC power supply. The command processing time is the time from when the command is first received to the point where the power supply starts acting on it. In this case it is when power supply’s output starts to change. The up-programming response time is the time the power supply takes for the output to rise and settle within a small band around the final output level, after processing the command instructing it to change its output level.


Figure 1: Power supply command processing and up-programming response times

The down-programming response time is like the up-programming response time except that the power supply is instead being programmed to a lower level. However, you need to look at down-programming independently as short up-programming time does not necessarily guarantee comparably short down-programming time. More basic performance DC power supplies usually lack an active down-programmer circuit that quickly brings down the output. In this case the down-programming response time can be very dependent on how much load the DUT presents to the power supply’s output.

How much difference is there in performance between more basic performance and higher performance DC power supplies on these throughput-related features? It can be considerable; over several orders of magnitude difference. As one example, command processing time can range from up to 100’s of milliseconds for entry-level power supplies to under 1 millisecond for high performance power supplies.
Another fundamental throughput-related feature of a DC power supply is its measurement time. There are a couple of aspects to consider here as well, which I will elaborate on in part 2 of this series on how fundamental features of power supplies impact your test throughput, in an upcoming posting here on “Watt’s Up?” along with tying it all together to show how they affect actual test throughput!