Friday, February 28, 2014

Use Agilent's BenchVue Software to Save Time

Hi everyone!

I wanted to take the time I have in this month’s blog post to tel you about a great new tool that we have for you here at Agilent.  It is a new software package called BenchVue.  BenchVue offers users the ability to control their power supplies, oscilloscopes, spectrum analyzers,  DMMs, and function generators using their computer without the need to write a program.  It is a free download.  You can download BenchVue at:

Agilent BenchVue Software


Naturally I am going to talk about the power supply potion of BenchVue (this is a power supply blog after all).  Presently the software supports the Agilent N6700 Modular Power Supplies and the Agilent E36xxA Basic Power Supplies.  I do not know if many people remember but we used to have a free software package for the E36xxA power supplies called Intuiilink.   BenchVue is  the modern successor to Intuiilink.  I recently checked BenchVue out on my E3646A DC Power Supply.  

The E3646A is a basic two output DC Power Supply.  BenchVue communicates with it using GPIB (in my case my Agilent 82357 USB/GPIB converter).  Take a look at the below picture:


You can program all of the basic settings (even for multiple channels) on your power supply on one screen.  If you used the front panel to do all of these entries it would take quite a while to navigate through all of the menus.  BenchVue saves you time by putting all of this in one place.  The other neat thing that I noticed is that you can get the voltage and current readback from both channels on the screen at the same time.  You can't see both channels on the front panel, you have to manually switch.

The other main feature of BenchVue that can save you some time is the built in datalogger.  For those of you that are unfamiliar with the term datalog, this is when an instrument takes measurements at a predetermined time interval and stores them in a file that you can look at later.  With BenchVue, you can set a datalog up to take a measurement as fast as every second.  You can then take the stored values and export them to Matlab, Microsoft Excel, Microsoft Word, or to a CSV file.  

You could write your own datalog program but the beauty of BenchVue is that you can set the log up by entering a few values and then just press the "Run" button to make it go.  You also do not have to worry about formatting the data or creating files since BenchVue does all of that for you.  You basically just run it, then export the data and then you can view it in your chosen format.

Here is a sample thirty second datalog where I logged the voltage on Output 1:


After it was complete, I just hit the "Export" button, chose Microsoft Excel and I got the following:


Pretty cool!

That's my short intro to the new Agilent BenchVue software.  Go download it.  Let us know any thoughts you have in the comments section.

Monday, February 24, 2014

How to test the efficiency of DC to DC converters, part 2 of 2

In part 1 of my posting on testing the efficiency of DC to DC converters (click here to review) I went over the test set up, the requirements for load sweep synchronized to the measurements, and details of the choice of the type and set up of the current load sweep itself. In this second part I will be describing details of the measurement set up, setting up the efficiency calculation, and results of the testing. This is based on using the N6705B DC Power Analyzer, N6782A SMUs, and 14585A software as a platform but a number of ideas can be applicable regardless of the platform.


Figure 1: Synchronized measurement and efficiency calculation set up

The synchronized measurement and efficiency calculation set up, and display of results are shown in Figure 1, taking note of the following details corresponding to the numbers in Figure 1:
  1. In the 14585A the data logging mode was selected to make and display the measurements. The oscilloscope mode could have just as easily been used but with a 10 second sweep the extra speed of sampling with the oscilloscope mode was not an advantage. A second thing about using the data logging mode is you can set the integration time period for each acquisition point. This can be used to advantage in averaging out noise and disturbances as needed for a smoother and more representative result. In this case an integration period of 50 milliseconds was used.
  2. To synchronize the measurements the data log measurement was set to trigger off the start of the load current sweep.
  3. Voltage, current, and power for both the input and output SMUs were selected to be measured and displayed. The input and output power are needed for the efficiency calculation.
  4. The measurements were set to seamless ranging. In this way the appropriate measurement range for at any given point was used as the loading swept from zero to full load.
  5. A formula trace was created to calculate and display the efficiency in %. Note that the negative of the ratio of output power to input power was used. This is because the SMU acting as a load is sinking current and so both its current and power readings are negative.


With all of this completed really all that is left to do is first start the data logging measurement with the start button. It will be “armed” and waiting from a trigger signal from the current load sweep ARB that had been set up. All that is now left to do is press the ARB start button. Figure 2 is a display of all the results after the sweep is completed.


Figure 2: DC to DC Converter efficiency test results

All the input and output voltage, current, and power measurements, and efficiency calculation (in pink) are display, but it can be uncluttered a bit by turning off the voltages and currents traces being displayed and just leave the power and efficiency traces displayed. This happened to be special DC to DC converter designed to give exceptionally high efficiency even down to near zero load, which can be seen from the graph. It’s interesting to note peak efficiency occurred at around 60% of full load and then ohmic losses start becoming more significant.

And that basically sums it all up for performing an efficiency test on a DC to DC converter!

Thursday, February 20, 2014

How to test the efficiency of DC to DC converters, part 1 of 2

I periodically get asked to provide recommendations and guidance on testing the efficiency of small DC to DC voltage converters. Regardless of the size of the converter, a DC source is needed to provide input power to the converter under constant voltage, while an electronic load is needed to draw power from the output, usually under constant current loading. The load current needs to be swept from zero to the full load current capability of the DC to DC converter while input power (input voltage times input current) and output power (output voltage times output current) are recorded. The efficiency is then the ratio of power out to power in, most often expressed in a percentage. An illustration of this is shown in Figure 1. In addition to sourcing and sinking power, precision current and voltage measurement on both the input and output, synchronized to the sweeping of the load current is needed.


Figure 1: DC to DC converter efficiency test set up

One challenge for small DC to DC voltage converters is finding a suitable electronic load that will operate at the low output voltages and down to zero load currents, needed for testing their efficiency over their range, from no load to full load output power. It turns out in practice many source measure units (SMUs) will serve well as a DC electronic load for testing, as they will sink current as well as source current.

Perhaps the most optimum choice from us is to use two of our N6782A 2-quadrant SMU modules installed in our N6705B DC Power Analyzer mainframe, using the 14585A software to control the set up and display the results.  This is a rather flexible platform intended for a variety of whatever application one can come up with for the most part. With a little ingenuity it can be quickly configured to perform an efficiency test of small DC to DC converters, swept from no load to full load operation. This is good for converters of 20 watts of power or less and within a certain range of voltage, as the N6782A can source or sink up to 6 V and 3 A or 20 V and 1 A, depending on which range it is set to. One of the N6782A operates as a DC voltage source to power the DUT and the second is operated as a DC current load to draw power from the DUT. A nice thing about the N6782A is it provides excellent performance operated either as a DC source or load, and operated either in constant voltage or constant current.

An excellent video of this set up testing a DC to DC converter was created by a colleague here, which you can review by clicking on the following link: “DC to DC converter efficiency test”.

The video does an excellent job covering a lot of the details. However, if you are interested in testing DC to DC converters using this set up I have a few more details to share here about it which should help you further along with setting it up and running it.

First, the two N6782A SMUs were set up for initial operating conditions. The N6782A providing DC power in was set up as a voltage source at the desired input voltage level and the second N6782A was set to constant current load operation with minimum (near zero) loading current.

Note that the 14585A software does not directly sweep the load current along the horizontal axis. The horizontal axis is time. That is why a time-based current sweep was created in the arbitrary waveform (ARB) section of the 14585A. In that way any point on the horizontal time axis correlates to a certain current load level being drawn from the output of the DUT. The ARB of course was set to run once, not repetitively. The 14585A ARB set up is shown in Figure 2.


Figure 2: Load current sweep ARB set up in 14585A software

This ARB sweep requires a little explanation.  While there are a number of pre-defined ARBs, and they can be used, an x3 power formula was chosen to be used instead. This provided a gradually increasing load sweep that allowed greater resolution of this data and display at light loads, where efficiency more quickly changes. As can be seen, the duration of the sweep, parameter x, was set to 10 seconds. As a full load current needed to be -1 A, using the actual formula (-x/10)3  gave us a gradually increasing load current sweep that topped out at -1A after 10 seconds of duration. The choice of 10 seconds was arbitrary. It only provided an easy way to watch the sweep on the 14585A graphing as it progressed. Finally, a short (0.1 second) pre-defined linear ramp ARB was added as a second part of the ARB sequence, to bring the load current back to initial, near zero, load conditions after the sweep was completed. This is shown in Figure 3.


Figure 3: Second part of ARB sweep to bring DUT load current back to initial conditions


I hope this gives you a number of insights about creative ways you can make use of the ARB. As there is a good amount of subtle details on how to go about making and displaying the measurements I’ll be sharing that in a second part coming up shortly, so keep on the outlook!

Friday, January 31, 2014

More Information on the Awesomeness of binary data

Hi everybody!

This month I am going to do a build on one of Ed's posts from this month.  It was titled "Using Binary Data Transfers to Improve Your Test Throughput".  If you have not read it, go ahead and click on the link. I'll be here when you get back.

I wanted to reiterate how drastic the difference is between using these two interfaces when you are reading large amounts of data.   I did some bench-marking a little while ago and I wanted to share it now with everybody.  Please note that these were quick tests that I did and in no way are official numbers.  In fact if you see anything wrong with my methods, please comment.   

The first thing that I will talk about is my method.  I did the test with a N6700B MPS Mainframe and a N6781A SMU module.  I wrote a program that set up the module to source 5 V and then take an array of voltage measurements.  I set it for the maximum number of measurement points (524288 points) with the fastest sample rate (though for this experiment the sample rate does not really matter).  Before I did the reading of the data from the N6700B to my PC I started a programmatic stopwatch and stopped the stopwatch after the reading was complete.  I looped 20 times and took the average.

One thing that I would highly recommend is to use the Agilent VISA-COM IO library.  The VISA-COM library offers a ReadIEEEBlock function that makes reading binary data really easy for you.  

The screenshot below shows the relevant loop and the calculation.  This program was written in VB and I used LAN to communicate with the instrument.


The other important piece that this is not showing is that I am setting the data format to real using FORM REAL command.  When you use ASCII, the command is FORM ASCII (this is also the default setting).

You can see the commented out ReadString command that I swapped in when I used the ASCII data format.  You can also see my extremely professional (and useful) "I am on line" counter that I put in so that I knew my program was looping correctly.

So now for the times.  ASCII format took around 100 s to read back all 524288 measurements into a string.  When I switched to the binary format, it took under 5 seconds. As you can see, that is a very drastic difference and if you are reading back a lot of data from an instrument that supports the binary format, you really need to use it.

I also did a few other experiments.  I changed the total number of points down to 1000.  The binary format took a little under 20 ms to read the data and the ASCII format took about 125 ms.  The last test that I did was 3 data points.  The binary format took a little less than 15 ms and the ASCII format took under 5 ms to make the measurement.  So you can see that as you read less and less data back, the ASCII format does catch up to the binary format and even exceed it.

Moral of the story is that if it is something more than a few points to read back, use binary because it will save you a ton of time.

That's all I have this month and I will be back next month!


Wednesday, January 29, 2014

Using a DC Power Supply to Regulate Energy

In a previous 2-part posting I talked about what power and energy is (part 1 – energy) (part 2 – power).  It is pretty straight-forward thing to do to use a DC power supply for regulating voltage or current. Constant voltage (CV) and constant current (CC) regulation are standard features of most all DC power supplies used in testing. However, what if you have an unusual application calling for applying a fixed amount of energy to your device under test (DUT)? For example, adding a fixed amount of energy to a calorimeter or chemical process, or testing the must (or must not) tripping energy of a fuse, or circuit breaker, or squib or detonator perhaps?

When the resistance of a device remains constant, it is relatively straight-forward to apply a fixed amount of energy to a DUT. By applying a fixed voltage or current, the power in the DUT remains constant. Then the energy is simply:

E = (V2/R)*t = (I2*R)*t

Where E is the energy in watt-seconds or joules, V is voltage in volts, R is resistance in ohms, I is the current in amps, and t is time in seconds. All you now need to do is apply the constant voltage or current for a pre-determined amount of time and you will then be delivering a fixed amount of energy to your DUT.

Many times however, a lot of DUTs do not maintain constant loading. The may have a dynamically varying loading by nature or its resistance dramatically increases as it heats up. How do you regulate a fixed amount of energy to your DUT under these circumstances? One possibility is to use one of a few specialized power supplies on the market can regulate their outputs with constant power. As the DUT’s loading decreases or increases the power supply will adjust its output accordingly in order to maintain a constant output power delivered to the DUT.  Again then, by applying this constant power for a pre-determined amount of time you will then be delivering a fixed amount of energy to your DUT.

Still, for DUTs that do not maintain constant loading, it is very often not desirable, or outright unacceptable, to apply constant power sourcing.. It may be you can only apply a fixed voltage or current to your DUT. What can you do for these circumstances? Time can no longer remain a fixed value when trying to regulate a fixed amount of energy. The solution becomes quite a bit more complex, as depicted in Figure 1.


Figure 1: Regulating a fixed amount of energy to a DUT

Putting the solution depicted in Figure 1 into practice can prove challenging. The watt-hour meter needs to provide a trigger out signal when the desired watt-hour (or watt-second) threshold level is reached. This becomes even more challenging if this response time required needs to be just fractions of a second for this set up. More than likely this may become a piece of customized hardware.

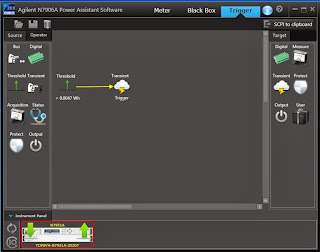
Interestingly this very set up can be programmatically configured within our N6900A and N7900A series Advanced Power System (APS) power supplies. These products have Amp-hour and Watt-hour measurement integrated into their measurement systems. Not only can you measure these parameters, there is a programmable way to act on them in a variety of ways as well, which is the expression signal routing. Logical expressions can be programmed and downloaded into APS, which then acts on them at hardware-level speeds.  Creating and loading the signal routing expression into the APS unit is simplified by using the N7906A Power Assistance software, which let me do it graphically, as shown in Figure 2.


Figure 2: Graphically developing and loading an energy limit setting into an Agilent APS unit

In Figure 2 a threshold comparator was set to generate a trigger output at a level of 0.0047 watt-hours. This trigger was then routed to the output transient system, to cause the output to transition to a new output level when triggered. I had entered in zero volts as the triggered output level. Thus when the watt-hour reading reached its trigger point, the output went to zero, cutting off any more power and energy from being delivered to the DUT.

The SCPI command set for this signal routing expression is also generated from this software utility by clicking on “SCPI to clipboard”. This saves on the effort generating the code manually if you are incorporating the expression into a larger test program. For this expression the code generated is:

:SENSe:THReshold1:FUNCtion WHOur
:SENSe:THReshold1:WHOur 0.0047
:SENSe:THReshold1:OPERation GT
:SYSTem:SIGNal:DEFine EXPRession1,"Thr1"
:TRIGger:TRANsient:SOURce EXPRession1


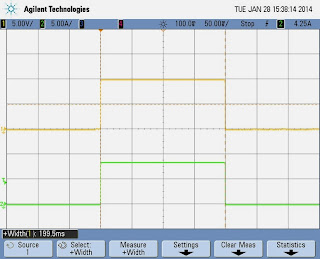
To test things out a 1.18 ohm resistive load was used to draw 84.75 watts for a 10 volt output setting. The output cut back to zero volts at nearly 200 milliseconds, as expected. This is shown in the oscilloscope capture in Figure 3.


Figure 3: APS output for an 84.75 watt load and energy limit set to 0.0047 watt-hours

The load power was then doubled by increasing the output voltage to 14.142 volts. The APS output cut back to zero volts in half the time, delivering the same amount of energy, as expected. This is depicted in the oscilloscope capture in Figure 4.


Figure 4: APS output for a 169.5 watt load and energy limit set to 0.0047 watt-hours

While using a resistor makes it easy to see that a set amount of energy is being delivered to the load. However, being able to act on a real time watt-hour energy measurement makes it very practical to do deliver a fixed amount of energy, regardless of the dynamic nature of the load over time.

Friday, January 24, 2014

Using Binary Data Transfers to Improve Your Test Throughput

From time to time I have shared here on “Watt’s Up?” a number of different ways the system DC power supply in your test set up impacts your test time, and recommendations on how to make significant improvements in the test throughput. Many of these previous posts are based on the first five of ten hints I’ve put together in a compendium entitled “10 Hints on Improving Throughput with your Power Supply” (click here for hints 1-5).

Oscilloscopes, data acquisition, and a variety of other test equipment are often used to capture and digitize waveforms and store large arrays of data during test, the data is then downloaded to a PC. These data arrays can be quite large, from thousands to millions of measurements. For long-term data logging the data files can be many gigabytes in size. These data files can take considerable time to transfer over an instrument bus, greatly impacting your test time.

Advanced system power supplies incorporating digitizing measurement systems to capture waveform measurements like inrush current are no different. This includes a number of system DC and AC power products we provide. Even though you usually have the choice of transferring data in ASCII format, one thing we recommend is instead transfer data in binary format. Binary data transmission requires fewer bytes reducing transfer time by a factor of two or more.


Further details about using binary mode data transfers can be found in hint 7 of another, earlier compendium we did, entitled “10 hints for using your power supply to decrease test time” (click here to access). Between these two compendiums of hints for improving your test throughput I expect you should be able find a few different ideas that will benefit your particular test situation!

Wednesday, January 8, 2014

Keysight Technologies – What’s in a name, anyway?

This is an exciting time for us! Yesterday, January 7, 2014, we learned what our new company name will be: Keysight Technologies. Here is a link to the official press release: 

If you have not heard by now, back in September of 2013, Agilent Technologies announced it would split into two companies by the end of 2014. Since I started in 1980, 33+ years ago, I have worked for and will continue to work for the electronic measurement side of the business. For my first 19 years with the company, we were Hewlett-Packard, a company that formed in 1939 as a test and measurement company and eventually birthed Silicon Valley. It is this electronic measurement side of the business that is getting the new name, just as we did in 1999 when we became Agilent from Hewlett-Packard. The other part of Agilent, the life sciences, diagnostics, and applied markets side will continue to operate under the Agilent name. Note that the electronic measurement side will still have the same great people designing and supporting the same great products and services….just a new name: Keysight Technologies.

So let’s take a closer look at the new name, logo, and tagline for Agilent’s electronic measurement business:


The name combines the words “key”, meaning essential, and “insight” meaning intuitive perception. Essential intuitive perception. Seeing what others cannot. A key can also be used to unlock something; we will continue to unlock measurement insights, as our tagline says. And we have been doing this for 75 years - since the day that Bill Hewlett and Dave Packard released their first electronic test instrument, an audio oscillator, in 1939. By the way, it is purely a coincidence that the Watt’s Up? authors, Ed, Matt, and I have combined experience of more than 75 years as stated in our blog header, although I’d like to think that the three of us have been unlocking measurement insights in the AC and DC power field for a combined total of 75 years! In fact, we now have a total of more than 80 years’ experience between the three of us and I will update the header later this year when we officially begin using the Keysight name. But I digress...

The logo symbol is derived from one of the most fundamental wave shapes there is: a sine wave – a wave shape from which all other wave shapes can be built. This is very appropriate for our 100% focus on electronic measurement, not to mention a tribute to our original founders, Bill and Dave, for their audio oscillator. And the power products and topics that you read about here in Watt’s Up? are equally represented by the logo symbol, especially our AC sources! If you really think about it, Keysight will be doing what Hewlett-Packard originally set out to do and Agilent continued to do for decades: build the world’s leading test and measurement company.

So what’s in a name? Essential intuitive perception is in our name. A clear focus on electronic measurement is in our name. Our strong and deep heritage is in our name. And when we begin to fully operate as Keysight Technologies later this year, what you will find behind our name will be the same high quality products and people that you have come to know. That’s what’s in the name Keysight Technologies!