Showing posts with label 14585A software. Show all posts

Wednesday, March 11, 2015

Comparing effects of using pulsed and steady state power to illuminate a high brightness LED

I was having a discussion here with a colleague about the merits of powering a high brightness LED (HBLED) using pulsed power versus using steady state DC power.

My opinion was: “Basically, amperes in proportionally equates to light flux out, so you will get about the same amount of illumination whether it is pulsed or DC.”

His argument was: “Because the pulses will be brighter, it’s possible the effective illumination that’s perceived will be brighter. Things appear to be continuous when discrete fixed images are updated at rates above thirty times a second, and that should apply to the pulsed illumination as well!”

I countered: “It will look the same and, if anything, will be less efficient when pulsed!”

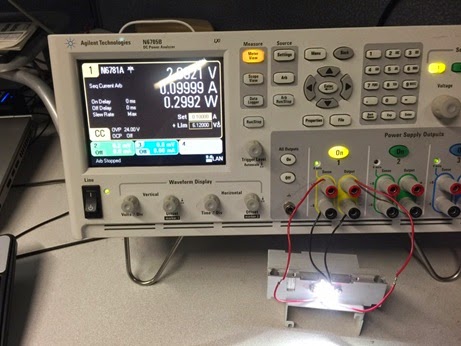
So instead of continuing our debate we ran a quick experiment. I happened to have some HBLEDs so I hooked one up to an N6781A DC source measure module housed in an N6705B DC Power Analyzer sitting at my desk, shown in Figure 1. The N6781A has excellent current sourcing characteristics regardless whether it is DC or a dynamic waveform, making it a good choice for this experiment.


Figure 1: Powering up an HBLED

First we powered it up with a steady state DC current of 100 mA. At this level the HBLED had a forward voltage drop of 2.994 V and resulting power of 0.2994 W, as seen in Figure 2, captured using the companion 14585A control and analysis software.


Figure 2: Resulting HBLED voltage and power when powered with 100 mA steady state DC current

We then set the N6781A to deliver a pulsed current of 200 mA with a 50% duty cycle, so that its average current was 100 mA. The results were again captured using the 14585A software, as shown in Figure 3.


Figure 3: Resulting HBLED voltage and power when powered with 200 mA 50% DC pulsed current

Switching back and forth between steady state DC and pulsed currents, my colleague agreed, the brightness appeared to be comparable (just as I had expected!).  But something more interesting to note is the average current, voltage, and power. These values were obtained as shown in Figure 3 by placing the measurement markers over an integral number of waveform cycles. The average current was 100 mA, as expected. Note however that the average voltage is lower, at 2.7 V, while the average power is higher, at 0.3127 W! At first the lower average voltage together with higher average power would seem to be a contradiction. How can that be?

First, in case you did not notice, the product of the RMS voltage and RMS current are 0.3897 W which clearly does not match our average power value displayed. What, another contradiction? Why is that? Multiplying RMS voltage and RMS current will give you the average power for a linear resistive load but not for a non-linear load like a HBLED. The average power needs to be determined by taking an overall average of the power over time computed on a point-by-point basis, which is how it is done within the 14585A software as well as within our power products that digitize the voltage and current over time. Second, the average voltage is lower because it drops down towards zero during periods of zero current. However it is greater during the periods when 200 mA is being sourced through the HBLED and these are the times where power is being consumed.

So here, by using pulsed current, our losses ended up being 4.4% greater when powered by the comparable steady state current. These losses are mainly incurred as a result of greater resistive drop losses in the HBLED occurring at the higher current level.
There is supposed to be one benefit however of using pulsed power when powering HBLEDs. At different steady state DC current levels there is some shift in their output light spectrum. Using pulsed current provides dimming control while maintaining a constant light spectrum. This prevents minor color shifts at different illumination levels. Although I would probably never notice it!

Friday, December 5, 2014

Why does the response time of OCP vary on the power supply I am using and what can I do about it? Part 2

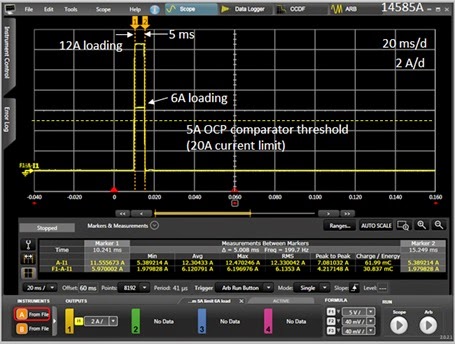
In the first part of this posting (click here to review) I highlighted what kind of response time is important for effective over current protection of typical DUTs and what the actual response characteristic is for a typical over current protect (OCP) system in a test system DC power supply. For reference I am including the example of OCP response time from the first part again, shown in Figure 1.


Figure 1: Example OCP system response time vs. overdrive level

Here in Figure 1 the response time of the OCP system of a Keysight N7951A 20V, 50A power supply was characterized using the companion 14585A software. It compares response times of 6A and 12A loading when the current limit is set to 5A. Including the programmed OCP delay time of 5 milliseconds it was found that the actual total response time was 7 milliseconds for 12A loading and 113 milliseconds for 6A loading.  As can be seen, for reasons previously explained, the response time clearly depends on the amount of overdrive beyond the current limit setting.

As the time to cause over current damage depends on the amount of current in excess of what the DUT can tolerate, with greater current causing damage more quickly, the slower response at lower overloads is generally not an issue.  If however you are still looking how you might further improve on OCP response speed for more effective protection, there are some things that you can do.

The first thing that can be done is to avoid using a power supply that has a full output current rating that is far greater than what the DUT actually draws. In this way the overdrive from an overload will be a greater percentage of the full output current rating. This will normally cause the current limit circuit to respond more quickly.

A second thing that can be done is to evaluate different models of power supplies to determine how quickly their various current limit circuits and OCP systems respond in based on your desired needs for protecting your DUT. For various reasons different models of power supplies will have different response times. As previously discussed in my first part, the slow response at low levels of overdrive is determined by the response of the current limit circuit.

One more alternative that can provide exceptionally fast response time is to have an OCP system that operates independently of a current limit circuit, much like how an over voltage protect (OVP) system works. Here the output level is simply compared against the protect level and, once exceeded, the power supply output is shut down to provide near-instantaneous protection. The problem here is this is not available on virtually any DC power supplies and would normally require building custom hardware that senses the fault condition and locally disconnects the output of the power supply from the DUT. However, one instance where it is possible to provide this kind of near-instantaneous over current protection is through the programmable signal routing system (i.e. programmable trigger system) in the Keysight N6900A and N7900A Advanced Power System (APS) DC power supplies. Configuring this triggering is illustrated in Figure 2.


Figure 2: Configuring a fast-acting OCP for the N6900A/N7900A Advanced Power System

In Figure 2 the N7909A software utility was used to graphically configure and download a fast-acting OCP level trigger into an N7951A Advanced Power System. Although this trigger is software defined it runs locally within the N7951A’s firmware at hardware speeds. The N7909A SW utility also generates the SCPI command set which can be incorporated into a test program.


Figure 3: Example custom-configured OCP system response time vs. overdrive level

Figure 3 captures the performance of this custom-configured OCP system running within the N7951A. As the OCP threshold and overdrive levels are the same this can be directly compared to the performance shown in Figure 1, using the conventional, current limit based OCP within the N7951A. A 5 millisecond OCP delay was included, as before. However, unlike before, there is now virtually no extra delay due to a current limit control circuit as the custom-configured OCP system is totally independent of it. Also, unlike before, it can now be seen the same fast response is achieved regardless of having just a small amount or a large amount of overdrive.

Because OCP systems rely on being initiated from the current limit control circuit, the OCP response time also includes the current limit response time. For most all over current protection needs this is usually plenty adequate.  If a faster-responding OCP is called for minimizing the size of the power supply and evaluating the performance of the OCP is beneficial. However, an OCP that operates independently of the current limit will ultimately be far faster responding, such as that which can be achieved either with custom hardware or making use of a programmable signal routing and triggering system like that found in the Keysight N6900A and N7900A Advanced Power Systems.

Wednesday, September 17, 2014

Simulating battery contact bounce, part 1

One test commonly done during design validation of handheld battery powered devices is to evaluate their ability to withstand a short loss of battery power due to being bumped and the contacts momentarily bouncing open, and either remain operating or have sufficient time to handle a shutdown gracefully. The duration of a contact bounce can typically range anywhere from under a millisecond to up to 100 milliseconds long.

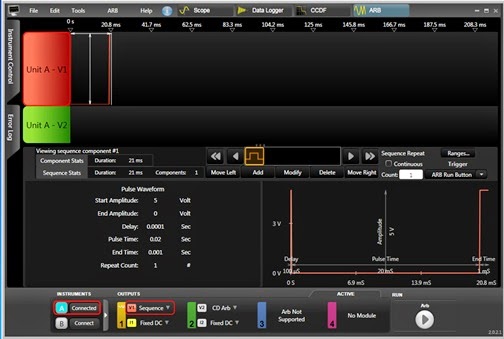
To simulate battery contact bouncing one may consider programming a voltage drop out on a reasonably fast power supply with arbitrary waveform capabilities, like several of the N675xA, N676xA, or N678xA series modules used in the N6700 series Modular DC Power System or N6705B DC Power Analyzer mainframe, shown in Figure 1. It is a simple matter to program a voltage dropout of specified duration. As an example a voltage dropout was programmed in Figure 2 on an N6781A SMU module using the companion 14585A software.


 Figure 1: N6700 series and N6705B mainframes and modules


Figure 2: Programming a voltage drop out using the N6705B and N6781A SMU module

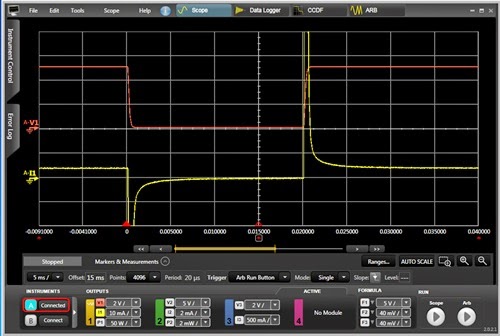
While a voltage dropout is fine for many applications, like automotive, in many situations it does not work well for simulating battery contact bounce. The reason for this is there is one key difference to note about a voltage dropout versus a battery contact bounce. During a voltage dropout the source impedance remains low. During a battery contact bounce the source impedance is an open circuit. However, a DC source having the ability to generate a fast voltage dropout is a result of it being able to pull its output voltage down quickly. This is due to its ability to sink current as well as source current. The problem with this is, for many battery powered devices, this effectively short-circuits the battery input terminals, more than likely causing the device to instantly shut down by discharging any carry-over storage and/or disrupting the battery power management system. As one example consider a mobile device having 50 microfarads of input capacitance and draws 4 milliamps of standby current. This capacitance would provide more than adequate carryover for a 20 millisecond battery contact bounce. However, if a voltage dropout is used to simulate battery contact bounce, it immediately discharges the mobile device’s input capacitance and pulls the battery input voltage down to zero, as shown by the red voltage trace in Figure 3. The yellow trace is the corresponding current drain. Note the large peaks of current drawn that discharge and recharge the DUT’s input capacitor.


 Figure 3: Voltage dropout applied to DUT immediately pulls voltage down to zero

One effective solution for preventing the DC source from shorting out the battery input is to add a DC blocking diode in series with the battery input, so that current cannot flow back out, creating high impedance during the dropout. This is illustrated in Figure 4.


Figure 4: Blocking diode added between SMU and DUT

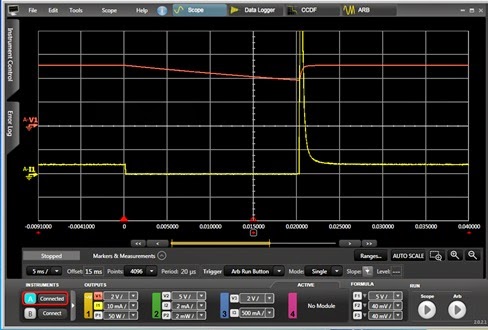
One thing to note here is the diode’s forward voltage drop needs to be compensated for. Usually the best way to do this just program the DC source with the additional voltage needed to offset the diode’s voltage drop. The result of this is shown in Figure 5. As shown by the red trace the voltage holds up relatively well during the contact bounce period. Because the N6781A SMU has an auxiliary voltage measurement input it is able to directly measure the voltage at the DUT, on the other side of the blocking diode, instead of the output voltage of the N6781A. As seen by the yellow current trace there is no longer a large peak of current discharging the capacitor due to the action of the blocking diode.


 Figure 5: Blocking diode prevents voltage dropout from discharging DUT 

Now you should have a much better appreciation of the differences between creating a voltage dropout and simulating battery contact bounce! And as can be seen a blocking diode is a rather effective means of simulating battery contact bounce using a voltage dropout. Stay tuned for my second part on additional ways of simulating battery contact bounce on an upcoming posting.
.


Wednesday, April 30, 2014

New Software Update for the N7900 Advanced Power System

Hi everybody,

Last year, we introduced the Agilent N7900 Advanced Power System (hereon in shortened to N7900 APS).  The N7900 APS is a full of great features that can only be accessed using the instrument's programming interface.  The programming interface works very well but sometimes you just don't want write and troubleshoot a program, you just want something that works.

Well, I have the chance to share some pretty exciting news.  We want to provide you software that makes some of these great features easy for you to use.  The software is the 14585A Control and Analysis Software.  This software was previously only available for the N6705 DC Power Analyzer.

The 14585A software is a standalone application that unlocks three key features: it allows you to look at a graphical representation of the measured data in Scope Mode, create arbitrary waveforms in Arb mode, and log long term data in datalogger mode.  These three advanced features can be setup and run by adjusting a few settings and pressing a few buttons.

 The software comes with a 30 day free trial so feel free to download it to check it out.  Please note that you need at least version A.01.13 of the APS firmware in order to use the software.

You can find the latest APS firmware at:
APS Firmware

You can find the software at:
14585A Software

If you have any questions on the software, feel free to leave us some comments.  Thanks for reading!