Showing posts with label battery-powered device. Show all posts

Friday, July 24, 2015

“Adaptive Fast Charging” for faster charging of mobile devices

In some of my previous posts I have talked about USB power delivery 2.0 providing greater power so that mobile devices can be charged up more quickly with their USB adapters.  A key part of this is these devices are incorporating adaptive fast charging systems to accomplish faster charging. So how does this all work anyway?

Let’s first look at the way existing USB charging work, depicted in Figure 1.


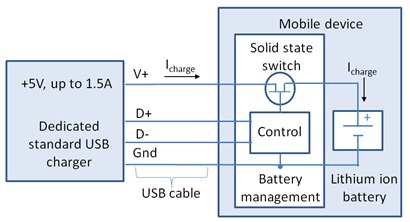
Figure 1: Legacy standard USB charging system

When the mobile device is connected to the USB adapter, the mobile device first determines what kind of USB port it is connected to and how much charging current is available that it will be able to draw in order to recharge its battery. The mobile device then proceeds to internally connect its battery up to the USB power through an internal solid state switch that regulates the charging via the device’s internal battery management. However, a major limitation here is the amount of available current and power. Today’s mobile devices are using larger batteries. Up to 4 Ah batteries are commonly used in smart phones and over 9 Ah capacity batteries are being used in tablets. Even with later updates that increased the charging current to 1.5 amps for a dedicated charging port, this is a small fraction of the charging current and power these larger batteries can handle. As one example, a 9 Ah battery having a 1C recommended maximum charging rate equates to a 9 amp charging current. This requires overnight in order to significantly recharge the battery using standard USB charging.

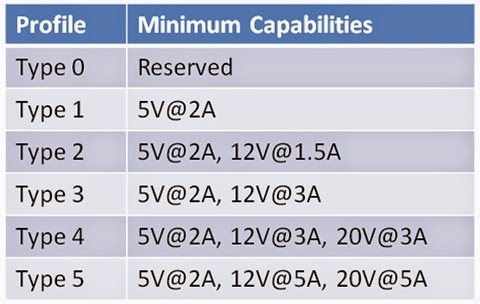
The shortcomings of legacy USB for battery charging purposes has been well recognized and the USB Power Delivery 2.0 specification has been released to increase the amount of power available to as much as 100 watts. This is accomplished by greater voltage, up to 20 volts, and greater current, up to 5 amps. For a mobile device incorporating this, together with an adaptive fast charging system, is able to charge its battery in much less time. This set up is depicted in Figure 2.


Figure 2: USB adaptive fast charging system

With adaptive fast charging, when the mobile device is connected to the USB adapter, after determining that it has compatible fast charging capabilities, it then negotiates for higher voltage and power. After the negotiation the adapter then increases its output accordingly. A key thing here is the mobile device will typically incorporate DC/DC power conversion in its battery management system. Here it will efficiently convert the adapter’s higher voltage charging power into greater charging current at a voltage level comparable to the mobile device’s battery voltage, to achieve much faster charging. Now you will be able to recharge your device over lunch instead of overnight!


Wednesday, July 15, 2015

Optimizing the performance of the zero-burden battery run-down test setup

Two years ago I added a post here to “Watt’s Up?” titled:  “Zero-burden ammeter improves battery run-down and charge management testing of battery-powered devices” (click here to review). In this post I talk about how our N6781A 20V, 3A 20W SMU (and now our N6785A 20V, 8A, 80W as well) can be used in a zero-burden ammeter mode to provide accurate current measurement without introducing any voltage drop. Together with the independent DVM voltage measurement input they can be used to simultaneously log the voltage and current when performing a battery run-down test on a battery powered device. This is a very useful test to perform for gaining valuable insights on evaluating and optimizing battery life. This can also be used to evaluate the charging process as well, when using rechargeable batteries. The key thing is zero-burden current measurement is critical for obtaining accurate results as impedance and corresponding voltage drop when using a current shunt influences test results. For reference the N678xA SMUs are used in either the N6705B DC Power Analyzer mainframe or N6700 series Modular Power System mainframe.
There are a few considerations for getting optimum performance when using the N678xA SMU’s in zero-burden current measurement mode. The primary one is the way the wiring is set up between the DUT, its battery, and the N678xA SMU. In Figure 1 below I rearranged the diagram depicting the setup in my original blog posting to better illustrate the actual physical setup for optimum performance.

Figure 1: Battery run-down setup for optimum performance
Note that this makes things practical from the perspective that the DUT and its battery do not have to be located right at the N678xA SMU.  However it is important that the DUT and battery need to be kept close together in order to minimize wiring length and associated impedance between them. Not only does the wiring contribute resistance, but its inductance can prevent operating the N678xA at a higher bandwidth setting for improved transient voltage response. The reason for this is illustrated in Figure 2.


Figure 2: Load impedance seen across N678xA SMU output for battery run-down setup
The load impedance the N678xA SMU sees across its output is the summation of the series connection of the DUT’s battery input port (primarily capacitive), the battery (series resistance and capacitance), and the jumper wire between the DUT and battery (inductive). The N678xA SMUs have multiple bandwidth compensation modes. They can be operated in their default low bandwidth mode, which provides stable operation for most any load impedance condition. However to get the most optimum voltage transient response it is better to operate N678xA SMUs in one of its higher bandwidth settings. In order to operate in one of the higher bandwidth settings, the N678xA SMUs need to see primarily capacitive loading across its remote sense point for fast and stable operation. This means the jumper wire between the DUT and battery must be kept short to minimize its inductance. Often this is all that is needed. If this is not enough then adding a small capacitor of around 10 microfarads, across the remote sense point, will provide sufficient capacitive loading for fast and stable operation. Additional things that should be done include:
  • Place remote sense connections as close to the DUT and battery as practical
  • Use twisted pair wiring; one pair for the force leads and a second pair for the remote sense leads, for the connections from the N678xA SMU to the DUT and its battery


By following these best practices you will get the optimum performance from your battery run-down test setup!

Tuesday, June 16, 2015

When is it best to use a battery or a power supply for testing my battery powered device?

As I do quite a bit of work with mobile battery powered devices I regularly post articles here on our “Watt’s Up?” blog about aspects on testing and optimizing battery life for these devices. As a matter of fact my posting from two weeks ago is about the webcast I will be doing this Thursday, June 18th: “Optimizing Battery Run and Charge Times of Today’s Mobile Wireless Devices”. That’s just two days away now!

With battery powered devices there are times it makes sense to use the device’s actual battery when performing testing and evaluation work to validate and gain insights on optimizing performance. In particular you will use the battery when performing a battery run-down test, to validate run-time. Providing you have a suitable test setup you can learn quite a few useful things beyond run-time that will give insights on how to better optimize your device’s performance and run-time. I go into a number of details about this in a previous posting of mine: “Zero-burden ammeter improves battery run-down and charge management testing of battery-powered devices”. If you are performing this kind of work you should find this posting useful.

However, there are other times when it makes sense to use a power supply in place of the device’s battery, to power up the device for the purpose of performing additional types of testing and evaluation work for optimizing the device’s performance. One major factor for this is the power supply can be directly set to specific levels which remain fixed for the desired duration. It eliminates the variability and difficulties of trying to do likewise with a battery, if at all possible. In most all instances it is important that the power supply provides the correct characteristics to properly emulate the battery. This includes:
  • Full two-quadrant operation for sourcing and sinking current and power
  • Programmable series resistance to simulate the battery’s ESR

These characteristics are depicted in the V-I graph in figure 1.


Figure 1: Battery emulator power supply output characteristics

Note that quadrant 1 operation is emulating when the battery is providing power to the device while quadrant 2 is emulating when the battery is being charge by the device.


A colleague here very recently had an article published that goes into a number of excellent reasons why and when it is advantageous to use a power supply in place of trying to use the actual battery, “Simulating a Battery with a Power Supply Reaps Benefits”. I believe you will find this to also be a useful reference.

Wednesday, June 3, 2015

Webcast this June 18th: Optimizing Battery Run and Charge Times of Today’s Mobile Wireless Devices

One thing for certain: Technological progress does not stand still for a moment and there is no place where this is any truer than for mobile wireless devices! Smart phones, tablets, and phablets have all but totally replaced yesterday’s mobile phones and other personal portable devices. They provide virtually unlimited information, connectivity, assistance, and all kinds of other capabilities anywhere and at any time.

However, as a consequence of all these greater capabilities and time spent being actively used is battery run time limitations. Battery run time is one of top dissatifiers of mobile device users. To help offset this manufacturers are incorporating considerably larger capacity batteries to get users through their day. I touched upon this several weeks ago with my earlier posting “Two New Keysight Source Measure Units (SMUs) for Battery Powered Device and Functional Test”. We developed higher power versions of our N678xA series SMUs in support of testing and development of these higher power mobile devices.

Ironically, a consequence of higher capacity batteries leads to worsening of another top user dissatifier, and that is battery charging time. Again, technological progress does not stand still! New specifications define higher power delivery over USB, which can be used to charge these mobile devices in less time. I also touched upon this just a few weeks ago with my posting “Updates to USB provide higher power and faster charging”. The power available over USB will no longer be the limiting factor on how long it takes to recharge a mobile device.

I have been doing a good amount of investigative work on these fronts which has lead me to put together a webcast “Optimizing Battery Run and Charge Times of Today’s Mobile Wireless Devices”. Here I will go into details about operation of these mobile devices during use and charging, and subsequent testing to validate and optimize their performance.  If you do development work on mobile devices, or even have a high level of curiosity, you may want to attend my webinar on June 18. Additional details about the webcast and registration are available at: “Click here for accessing webcast registration”. I hope you can make it!


Wednesday, May 20, 2015

Updates to USB provide higher power and faster charging

For those who regularly visit our blog here are already aware I do a fair amount of work with regard to test methodologies for optimizing battery life on mobile wireless devices. One directly related topic I have been actively investigating these past few months is the battery charging aspects for these devices. Recharging the battery on these devices takes a considerable amount of time; typically a couple of hours or longer, and it’s only been getting worse. However, there has been a lot of work, activity, and even new product developments that are making dramatic improvements in recharging your devices’ batteries in less time!

The USB port has become the universal connection for providing charging power for mobile devices. When initially available a USB port could provide up to 500 mA for general power for peripheral devices. It was recognized that this was also a convenient source for charging portable devices but that more current was needed. The USB BC (battery charging) standard was established which formalized charging initially for up to 1.5 amps at 5 volts.

This higher charging current and power was alright for mobile devices of a couple of generations ago, but today’s smart phones, tablets, and phablets are using much larger and higher capacity batteries. The end result is, because USB is 5 volts its power thus limited to 7.5W, that it can take several hours to recharge a device’s battery.  This can be very inconvenient if your battery goes dead during the day!

Simply increasing the USB current is not a total answer as this has limitations. First, the micro USB connectors on mobile devices are rated for no more than about 1.8 to 2 amps. To help on this front there is the new USB Type-C cable and connector specification released last year. The new type-C micro connectors are able to handle up to 3 amps and the standard connectors able to handle up to 5 amps. Higher current alone is not quite enough. Also issued last year was the new USB Power Delivery 2.0 specification. This specifies a system capable of providing up to 20 volts and 5 amps. This is more than order of magnitude improvement in power over the existing USB power. Long charging times due to power limitations will become a thing of the past.

The new USB power delivery voltages and currents are a discrete set of levels as shown in table 1. As can be seen the levels depend on the profile/port designation.


Table 1: USB power delivery 2.0 voltage and current levels

The cables and connectors of course need to be able to handle the given level of current and power.  In review of the standard a lot of work and effort has gone into providing this new capability while maintaining compatibility with the past as well. Thus for a new mobile device to take advantage of these higher power levels, it must be capable of negotiating with the charging power port to furnish it. At the same time, if an earlier generation mobile device is connected, it will only be able to get the default USB 5 volt level.


I’m looking forward to seeing this new USB power delivery put into wide-spread use in various innovative new products. Expect to see more about this topic in future posts from me here!

Tuesday, February 24, 2015

Two New Keysight Source Measure Units (SMUs) for Battery Powered Device and Functional Test

Over the past few years here on “Watt’s Up?” I have posted several articles and application pieces on performing battery drain analysis for optimizing run time on mobile wireless devices. The key product we provide for this application space is the N6781A 20V, +/-3A, 20W source measure module for battery drain analysis. A second related product we offer is the N6782A 20V, +/-3A, 20W source measure module for functional test. The N6782A has a few less key features used for battery drain analysis but is otherwise the same as the N6781A. As a result the N6782A is preferred product for testing many of the components used in mobile devices, where the extra battery drain analysis features are not needed. These products are pictured in Figure 1. While at first glance they may appear the same, one thing to note is the N6781A has an extra connector which is independent voltmeter input. This is used for performing a battery run-down test, one of a number of aspects of performing battery drain analysis. Details on these two SMUs can be found on by clicking on: N6781A product page.  N6782A product page,


Figure 1: Keysight N6781A SMU for battery drain analysis and N6782A for functional test

These products have greatly helped customers through their combination of very high performance specialized sourcing and measurement capabilities tailored for addressing the unique test challenges posed by mobile wireless devices and their components. However, things have continued to evolve (don’t they always!). Today’s mobile devices, like smart phones, tablets and phablets, have an amazing amount of capabilities to address all kinds of applications. However, their power consumption has grown considerably as a result. They are now utilizing much larger batteries to support this greater power consumption in order to maintain reasonably acceptable battery run-time. Optimizing battery life continues to be a critical need when developing these products. With their higher power however, there is in turn a greater need for higher power SMUs to power them during test and development. In response we have just added two new higher power SMUs to this family; the N6785A 20V, +/-8A, 80W source measure module for battery drain analysis and the N6785A 20V, +/-8A, 80W source measure module for functional test. These products are pictured in Figure 2. Details on these two new higher power SMUs can be found on by clicking on: N6785A product page.  N6786A product page.


Figure 2: Keysight N6785A SMU for battery drain analysis and N6786A for functional test

A press release went out about these two new SMUs yesterday; Click here to view. With their greater current and power capability, customers developing and producing these advanced mobile wireless devices and their components now have a way to test them to their fullest, not being encumbered by power limitations of lower power SMUs.

This is exciting to me having been working within the industry for quite some time now, helping customers increase battery life by improving how their devices make more efficient use of the battery’s energy. A key part of this has been by using our existing solutions for battery drain analysis to provide critical insights on how their devices are making use of the battery’s energy.  There is a lot of innovation in the industry to make mobile wireless devices operate with even greater efficiency at these higher power and current levels. There is no other choice if they are going to be successful. Likewise, it is great to see continuing to play a key role in this trend in making it a success!

.

Monday, October 6, 2014

Simulating battery contact bounce, part 2

In part 1 of this posting on simulating battery contact bounce (click here to review) I discussed what battery contact bounce is about and why creating a voltage dropout may not be adequate for simulating battery contact bounce. The first answer to addressing this was provided; use a blocking diode and then a voltage dropout is certain to be suitable for simulating battery contact bounce.

Another approach for simulating battery contact bounce is to add a solid state switch between the DC source and the battery powered device. While this is a good approach it is complex to implement. A suitable solid state switch needs to be selected along with coming up with an appropriate way to power and drive the input of the switch need to be developed.

If for some reason using a blocking diode is not suitable, there is yet another fairly simple approach that can be taken to simulate high impedance battery contact bounce. Instead of programming a voltage dropout on the DC source, program a current dropout. Where the voltage going to zero during a voltage dropout is effectively a short circuit, as we saw in part 1, the current going to zero during a current dropout is effectively an open circuit. There are a couple of caveats for doing this. The main one is battery powered devices are powered from a battery, which is a voltage source, not a current source. In order for the DC source to act as a voltage source when delivering power, we need to rely on the DC source voltage limit being set to the level of the battery voltage. In order for this to happen we need to set the non-dropout current level to be in excess of the maximum level demanded by the device being powered and. Thus the DC source will normally be operating in voltage limit. Then when the current dropout drives the output current to zero, the DC source switches its operating mode from voltage limit to constant current, with a current value of zero. This operation is depicted in Figure 4, using a Keysight N6781A 2-quadrant SMU module designed for testing battery powered devices, operating within an N6705B DC Power Analyzer. In this example the current ARB for the dropout was both programmed and the results shown in Figure 1 captured using the companion 14585A software.


Figure 1: Current ARB creates a high impedance dropout to simulate battery contact bounce

Another caveat with using this approach for simulating battery contact bounce is paying careful attention to the behavior of the mode crossovers. For the first crossover, from voltage limit to constant current operation (at zero current) there is a small amount of lag time, typically just a fraction of a millisecond, before the transition happens. This becomes more significant only when trying to simulate extremely short contact bounce periods. More important is when crossing back over from constant zero current back to voltage limit operation. There is a short period when the current goes up to its high level before the voltage limit gains control, holding the voltage at the battery’s voltage level. Usually any capacitance at the input of the DUT will normally absorb any short spike of current. If this crossover is slow enough, and there is very little or no capacitance, the device could see a voltage spike. The N6781A has very fast responding circuits however, minimizing crossover time and inducing just 250 mV of overshoot, as is seen in Figure 1.

Hopefully, now armed with all of these details, you will be able to select an approach that works best for you for simulating battery contact bounce!


Wednesday, September 17, 2014

Simulating battery contact bounce, part 1

One test commonly done during design validation of handheld battery powered devices is to evaluate their ability to withstand a short loss of battery power due to being bumped and the contacts momentarily bouncing open, and either remain operating or have sufficient time to handle a shutdown gracefully. The duration of a contact bounce can typically range anywhere from under a millisecond to up to 100 milliseconds long.

To simulate battery contact bouncing one may consider programming a voltage drop out on a reasonably fast power supply with arbitrary waveform capabilities, like several of the N675xA, N676xA, or N678xA series modules used in the N6700 series Modular DC Power System or N6705B DC Power Analyzer mainframe, shown in Figure 1. It is a simple matter to program a voltage dropout of specified duration. As an example a voltage dropout was programmed in Figure 2 on an N6781A SMU module using the companion 14585A software.


 Figure 1: N6700 series and N6705B mainframes and modules


Figure 2: Programming a voltage drop out using the N6705B and N6781A SMU module

While a voltage dropout is fine for many applications, like automotive, in many situations it does not work well for simulating battery contact bounce. The reason for this is there is one key difference to note about a voltage dropout versus a battery contact bounce. During a voltage dropout the source impedance remains low. During a battery contact bounce the source impedance is an open circuit. However, a DC source having the ability to generate a fast voltage dropout is a result of it being able to pull its output voltage down quickly. This is due to its ability to sink current as well as source current. The problem with this is, for many battery powered devices, this effectively short-circuits the battery input terminals, more than likely causing the device to instantly shut down by discharging any carry-over storage and/or disrupting the battery power management system. As one example consider a mobile device having 50 microfarads of input capacitance and draws 4 milliamps of standby current. This capacitance would provide more than adequate carryover for a 20 millisecond battery contact bounce. However, if a voltage dropout is used to simulate battery contact bounce, it immediately discharges the mobile device’s input capacitance and pulls the battery input voltage down to zero, as shown by the red voltage trace in Figure 3. The yellow trace is the corresponding current drain. Note the large peaks of current drawn that discharge and recharge the DUT’s input capacitor.


 Figure 3: Voltage dropout applied to DUT immediately pulls voltage down to zero

One effective solution for preventing the DC source from shorting out the battery input is to add a DC blocking diode in series with the battery input, so that current cannot flow back out, creating high impedance during the dropout. This is illustrated in Figure 4.


Figure 4: Blocking diode added between SMU and DUT

One thing to note here is the diode’s forward voltage drop needs to be compensated for. Usually the best way to do this just program the DC source with the additional voltage needed to offset the diode’s voltage drop. The result of this is shown in Figure 5. As shown by the red trace the voltage holds up relatively well during the contact bounce period. Because the N6781A SMU has an auxiliary voltage measurement input it is able to directly measure the voltage at the DUT, on the other side of the blocking diode, instead of the output voltage of the N6781A. As seen by the yellow current trace there is no longer a large peak of current discharging the capacitor due to the action of the blocking diode.


 Figure 5: Blocking diode prevents voltage dropout from discharging DUT 

Now you should have a much better appreciation of the differences between creating a voltage dropout and simulating battery contact bounce! And as can be seen a blocking diode is a rather effective means of simulating battery contact bounce using a voltage dropout. Stay tuned for my second part on additional ways of simulating battery contact bounce on an upcoming posting.
.


Thursday, April 3, 2014

Why have programmable series resistance on a power supply’s output?

A feature we’ve included on our 663xxA Mobile Communications DC Sources, our N6781A 2-quadrant Source Measure Module, and most recently our N69xxA and N79xxA Advanced Power System (APS) is the ability to program in a value for a resistance that exists in series with the output voltage. So why do we offer this?

 Batteries are not ideal voltage sources. They have a significant amount of equivalent series resistance (ESR) on their output. Because of this, the battery’s output has a voltage drop that is proportional to the current drawn by the DUT that is being powered. An example of this is shown in the oscilloscope capture in Figure 1, where a GPRS mobile handset is drawing pulsed transmit current from its battery.


Figure 1: Battery voltage and current powering a GPRS handset during transmit

In comparison, due to control feedback, a conventional DC power supply has extremely low output impedance. At and near DC, for all practical purposes, the DC output resistance is zero. At the same time, during fast load current transition edges, many conventional DC power supplies can have fairly slow transient voltage response, leading to significant transient overshoots and undershoots with slow recovery during these transitions, as can be seen in the oscilloscope capture in Figure 2.


Figure 2: Example general purpose bench power supply powering a GPRS handset during transmit

It’s not hard to see that the general purpose bench power supply voltage response is nothing close to that of the battery’s voltage response and recognize that it will likely have a significant impact on the performance of the GPRS handset. Just considering the performance of the battery management, the battery voltage drop during loading and rise during charging, due to the battery’s resistance, will impact discharge and charge management performance.

We include programmable resistance in the above mentioned DC power supplies as they are battery simulators.  By being able to program a series output resistance these power supplies are able to better simulate the voltage response of a battery, as shown in Figure 3.


Figure 3: N6781A battery simulator DC source powering a GPRS handset during transmit

While the 663xxA and N6781A are fairly low power meant to simulate batteries for handheld mobile devices, The N69xxA and N79xxA APS units are 1 and 2 KW power supplies meant to simulate much larger batteries used in things like satellites, robotics, regenerative energy systems, and a number of other higher power devices. Figure 4 shows the voltage response of an N7951A 1 KW APS unit programmed to 20 milliohms output impedance, having a +/- 10 amp peak sine wave load current applied to its output.


Figure 4: N7951A 1 KW APS DC source voltage response to sine wave load

Programmable series output resistance is one more way a specialized DC source helps improve performance and test results, in this case doing a better job simulating the battery that ultimately powers the device under test.

Thursday, August 15, 2013

Techniques for using the Agilent N6781A and N6782A and their seamless measurement ranging when currents exceed 3 amps

In an earlier posting “Zero-burden ammeter improves battery run-down and charge management testing of battery-powered devices” (click here to access) I had talked about how the Agilent N6781A 2-quadrant SMU can alternately be used as a zero-burden ammeter. When placed in the current path as a zero-burden ammeter, due to its extended seamless measurement ranging, it can measure currents from nanoamps, up to +/-3 amps, which is the maximum limit of the N6781A. The N6782A 2-quadrant SMU can also be used as a zero burden ammeter. It is basically the same as the N6781A but with a few less features.

One customer liked everything about the N6782A’s capabilities, but he had a battery-powered device that drew well over 3 amps when it was active. When in standby operation its current drain ranged back and forth between just microamps of sleep current to 6 or greater amps of current during periodic wake ups. The N6782A’s +/- 3 amps of current was not sufficient to meet their needs.

An alternate approach was taken that worked out well for this customer, which was made possible only because of the N6782A’s zero-burden ammeter capability. The set up is shown in Figure 1.


Figure 1: Setup for measuring micro-amps in combination with large active-state currents

The N6752A 50V, 10A, 100W autoranging DC power module provides all the power. The N6782A is set up as a zero-burden ammeter and is connected in series with the N6752A’s output. When current ranges from microamps up to +/- 3 amps the N6782A maintains its zero-burden ammeter operation, holding its output voltage at zero. Once +/- 3 amps is exceeded, the N6782A goes into current limit and the voltage increases across its output, at which point one of the back-to-back clamp diodes turns on, conducting current in excess of 3 amps through it. This all can be observed in the screen image of the 14585A software in Figure 2. The blue trace is the N752A’s output current. The middle yellow trace is the N6781A’s current and the top yellow trace is the N6781A’s voltage.


Figure 2: Current and voltage signals for Figure 1 setup captured with 14585A software

In Figure 2 measurement markers have been placed across a portion of the sleep current and we find from the N6782A’s measurement readback it is just 1.458 microamps average. The reason why this works is because of zero burden operation. Because the N6782A is maintaining zero volts across its output, there is no current flowing through either diode. If this same thing was attempted using a conventional ammeter or current shunt, the voltage would increase and current would flow through a diode, corrupting the measurement.

Now the customer was able to get the microamp sleep current readings from the N6782A and at the same time get the high level wake up current readings from the N6752A!

In a similar fashion another customer wanted to perform battery run down testing. Everything was excellent about using the N6781A in its zero-burden ammeter mode, along with using its independent DVM input for simultaneously logging the battery’s run down voltage in conjunction with the current. The only problem was they wanted to test a higher power device. At device turn-on, it would draw in excess of 3 amps, which is the current limit of the N6781A. Current limit would cause the N6781A to drop out of its zero-burden ammeter operation and in turn the device would shut back down due to low voltage. The solution was simple; add the back-to-back diodes across the N6781A acting as a zero-burden ammeter, as shown in Figure 3.  Any currents in excess of 3 amps would then pass through a diode. Schottky diodes were used so the device would momentarily see just a few tenths of a volt drop in the battery voltage, during the short peak current in excess of 3 amps. Now the customer was able to perform battery run-down testing using the N6781A along with the 14585A software to log all the results!


Figure 3: Agilent N6781A battery run-down test set up, with diode clamps for peak currents above 3A


Thursday, August 8, 2013

Zero-burden ammeter improves battery run-down and charge management testing of battery-powered devices

One way of assessing run-time of battery-powered devices is to power them up with a regulated DC source, place the device into its appropriate operating modes, and get the corresponding current drawn by the device for each of the various operating modes. Estimations of battery run-time can then be made for different user types, based on the percentage of time spent in each of these operating modes, and the capacity of the battery in mA-hours. The DC source must be able to maintain a stable, transient free voltage at the DUT. A lot of general purpose power supplies have difficulty with mobile wireless devices that draw fast rising, high peak currents. Providing the regulated DC source meets maintains a stable voltage, it offers some advantages, including:
  • Maintains a fixed voltage level over time, removing variability due to changing voltage.
  • Using built-in current read-back eliminates voltage drop issues encountered with using a resistive shunt. This is problematic with mobile wireless devices that draw high peak, but low average current.


An alternative to using a regulated DC source to power the battery powered device is instead use the actual battery. Just like with using a DC source, one can make representative current drain measurements over shorter periods for all the various operating modes and then make predictions on run-time. Alternately one can also perform actual battery run-down tests which, when performed correctly, yields quite a few more insights beyond representative current drain measurements, such as:
  • Low battery discharge termination details.
  • Battery capacity and energy actually delivered.
  • Actual run time achieved.
  • How well the battery and device work together as a system


An actual battery-run down test is an indispensable part of validation as a final proof of performance.

Just as with evaluating battery run-down, it is also just as important to evaluate battery charging and management. Again, a lot of testing can be done on a device independent of its battery, but there is also a lot of additional value in validating a device’s charge management performance with its actual battery.

When validating a device’s discharging and charging performance with an actual battery, the first test challenge is the current drawn from or sourced to the battery needs to be accurately measured and logged over time, together with the battery’s voltage, for making good capacity and energy measurements. The second test challenge here is you cannot afford to introduce any significant drop in voltage between the device and its battery, as this alters charging and discharging performance of the battery powered device. This can be a real problem when trying to use shunt resistors.

An alternative is to use a zero-burden ammeter. You may ask how an ammeter can be zero-burden. It has to have some resistance in order to produce a measurable value, right? Well, not always. Agilent provides an innovative alternative use of the N6781A 2-quadrant source measure module that enables it to operate as a zero-burden ammeter (in addition to being a DC source). Using the N6781A as a zero-burden ammeter to evaluate battery run-down and battery charging of a battery-powered device is depicted in Figure 1.


Figure 1: N6781A zero-burden ammeter / wattmeter operation

The N6781A is able to operate as a zero-burden ammeter because it is able to actively regulate its output at zero volts independent of the current flowing through it. Because its output is zero volts, when placed in series between the device and its battery, there is no voltage drop. At the same time its precision current measurement system is able to now measure the discharge or charge currents. In addition a separate voltage measurement port allows it to measure the battery voltage, so now you are able to capture the battery’s discharge or charge voltage profile, as well as determine charge in amp-hours and energy in watt-hours, as shown in Figure 2.


Figure 2: Capturing, displaying, and evaluating battery run-down results with 14585A software

A useful reference providing further details on evaluating a device’s battery run-down and charging, and how to configure and use the N6781A as a zero-burden ammeter are available in our application note; “Evaluating Battery Run-Down with the N6781A 2-Quadrant Source Measure Unit and the 14585A Control and Analysis Software” (click here to access).

Wednesday, March 20, 2013

Open sense lead detection, additional protection for remote voltage sensing


A higher level of voltage accuracy is usually always needed for powering electronic devices under test (DUTs). Many devices provide guaranteed specifications for operating at minimum, nominal, and maximum voltages, so the voltage needs to accurate as to not require unacceptable amounts of guard banding of the voltage settings.

One very significant factor that affects the accuracy of the voltage at the DUT is the voltage drop in the wiring between the output terminals of the power supply and the actual DUT fixture, due to wiring’s inherent resistance, as shown in Figure 1.


 A standard feature of most all system DC power supplies is remote voltage sensing. Instead of the voltage being regulated at the output terminals of the DC power supply’s output terminal, it is instead sensed and regulated at the DUT itself, compensating for the voltage drop in the wiring. Additional details of this are documented in an earlier posting: “Use remote sense to regulate voltage at your load”

While remote voltage sensing addresses the problem of voltage drop in wiring affecting the voltage accuracy at the DUT, it then raises the concern of what happens if one of the sense lines becomes disconnected. Will the DC power supply voltage climb up to it maximum potential causing my DUT to be damaged?  Although this is a very legitimate concern, often the voltage is usually kept within a reasonable range of the setting by a feature referred to as “open sense lead protection”. A deeper dive on the issue of open sense lines and open sense lead protection are discussed at our posting: “What happens if remote sense leads open?”

Even with open sense lead protection and the voltage being kept within a reasonable range of the setting, this can be a concern for some customers who are relying on a high level of DC voltage accuracy at the DUT for test and calibration purposes. One categorical example of this is battery powered devices, where ADC circuits that need to precisely monitor the battery input voltage have to be accurately calibrated. If the voltage from the DC power supply has significant error, the DUT will be miss-calibrated.

One issue with open sense lead protection is it is a passive protection mechanism. It is simply a back up that takes over when a sense line is open. There is no way of knowing the sense lead is open. No error flag is set or fault condition tripped. The voltage being read back is the same as that is being regulated by the voltage sensing error amplifier, which is the same as the set voltage, so all looks fine from a read-back perspective. This is where open sense lead detection takes over. Open sense lead detection is a system that actively checks to see if the sense lines are doing their job. If not it lets the test system know there is a fault.

Open sense detection is not a common feature for most system DC power supplies. As one example we do employ it in our 663xx series Mobile Communications DC Sources as these are used for powering, testing and calibrating battery powered wireless devices. In the case of an open sense line condition it generates a fault condition and it keeps the output of the DC source powered down. It also provides status information on which of the sense lines are open as well.

Thursday, November 15, 2012

Validating battery capacity under end-use conditions for battery powered mobile devices


One aspect (of many) I have talked about for optimizing battery life for battery powered mobile devices is assessing the battery’s actual capacity. Not only do you need to assess its capacity under conditions as stated by the manufacturer but also under conditions reflecting actual end use.

Validating the battery under a manufacturer’s stated conditions establish a starting point of what you might be achievable in how much capacity you can obtain from the battery and if it is in line with what the manufacturer states. Sometime it can be less for a variety of reasons. Even subtle differences in stated conditions can lead to fairly substantial differences in capacity. The stated conditions usually provide a “best case” achievable value for capacity. Do not be surprised if your results for the battery’s capacity fall a little short of the best case value provided by the manufacturer. With a little work you may be able to determine what subtle difference caused it, or simply, the best case value given is a bit optimistic.

Validating the battery under end-use conditions helps establish the difference you can expect between the battery’s capacity for rather ideal stated conditions against end-use conditions. Battery powered mobile devices draw current in a pulsed fashion, with high peaks in relation to the overall average current drain. An example of this kind of dynamic current drain is shown in Figure 1. In this case it is the active mode current drain of a GPRS smart mobile phone.


Figure 1: GPRS smart mobile phone dynamic current drain waveform

This usually significantly degrades the battery’s delivered capacity in comparison to the manufacturer’s stated conditions, which are based on a constant DC current discharge. If you do not take the impact of end-use loading conditions on the battery’s capacity into account there is a good chance the mobile device’s run-time will fall quite a bit short of expectations.

The usual way to validate a battery’s capacity under end-use conditions is to actually hook the battery together with its device, connect up logging instrumentation for recording the battery run down voltage and current over time, and then placing the device in a desired operating mode and let it run until the battery is run down. While a battery run-down test like this is useful to do it has a couple of issues when trying to focus explicitly on just the battery:
  • It is a test of the combination of the battery together with its host device. The host device also has influence on the test’s outcome and must be taken into account in assessing just the battery under end-use.
  • It can often be complex and difficult to set up the device in its desired operating condition, requiring a substantial amount of supporting equipment to recreate its environment for providing a realistic operating condition.
  • It can sometimes be difficult to get consistently repeatable results with the actual device.

An alternative to repeatedly using the actual device is to use an electronic load that can draw a dynamic current representative of the actual device the electronic load is being used in place of. In some cases a simple low duty cycle, high crest factor pulsed current waveform can be directly programmed into the electronic load. In cases where the host device’s current drain waveform is a bit more complex it may be useful to have an electronic load that is able to “play back” a digitized waveform file that is a representative portion of the device’s actual current drain, on an ongoing basis to run down the battery. As one example we put features into our 14585A software to simplify this record and playback approach using our N6781A 2-quadrant DC source measure module. This set up is depicted in Figure 2.


Figure 2: Current drain record and playback set up using the 14585 and N6781A

In the first half of this process the N6781A serves as a voltage source to power up the device while digitizing its dynamic current drain waveform. In the second half of this process the captured current drain waveform is inverted and then played back by the N6781A now instead operating as a constant current load connected to a battery to discharge it. A colleague in our office recently completed a video of how to do this record and playback process using a digital camera as an example, capturing the current drain waveform of the process of taking a picture. This could be played back repeatedly to determine how many pictures could be taken with a set of batteries, for example. I know with my digital camera I need to take a spare set of batteries with me as it uses up batteries quite quickly! The video is available to be viewed at the following link:“record and playback video”

Wednesday, September 26, 2012

Battery-killing cell phone apps? – Part 2

Back on May 25, 2012, I posted about mobile device users avoiding security apps because they think the apps run down their batteries too quickly (read that post here). I also mentioned that a member of the Anti-Malware Testing Standards Organization (AMTSO) is using Agilent’s N6705B DC Power Analyzer to evaluate just how much the security apps affect battery run time and that the results would not be available for a few months. Well, the results are in and guess what? Which security app you choose does not make much difference in your battery run time.

On average, they reported that the effect of using a security app on reducing battery run time is only about 2% which translates into less than 30 minutes of lost battery life per day. And the study went on to explain that the differences in performance of one mobile security product to another were small (they tested 13 products each from a different vendor). I was amused by the author’s comment that they were “not providing a ranking” because it “could get misused by marketing departments”. Indeed!

Here is a link to the report:
http://www.av-comparatives.org/images/docs/avc_mob_201209_en.pdf

The report shows a picture of Agilent’s N6705B DC Power Analyzer as the measuring device. They used this product because “This high-precision instrument can measure battery drain exactly”. A screen shot of Agilent’s 14585A Control and Analysis Software for the DC Power Analyzer was also shown in the report. The software allowed them to evaluate power consumption while performing various mobile phone tasks, such as making phone calls, viewing pictures, browsing websites, watching YouTube (I wonder if they watched any of the DC Power Analyzer videos we have posted!), watching locally stored videos, receiving and sending mails, and opening documents.

If the N6705B DC Power Analyzer and 14585A Control and Analysis Software can evaluate power consumption for all of those things, just think of what it could do for you! Check out Ed’s post from earlier this week for some of those things: http://powersupplyblog.tm.agilent.com/2012/09/optimizing-mobile-device-battery-run.html

Monday, September 24, 2012

Optimizing Mobile Device Battery Run-time Seminars


On many occasions in the past here both I, and my colleague, Gary, have written about measuring, evaluating, and optimizing battery life of mobile wireless battery powered devices. There is no question that, as all kinds of new and innovative capabilities and devices are introduced; battery life continues to become an even greater challenge.

I recently gave a two-part webcast entitled “Optimize Wireless Device Battery Run-time”. In the first part “Innovative Measurements for Greater Insights” a variety of measurement techniques are employed on a number of different wireless devices to illustrate the nature of how these devices operate and draw power from their batteries over time, and in turn how to go about making and analyzing the measurements to improve the device’s battery run-time. Some key points brought out in this first part include:
  • Mobile devices operate in short bursts of activities to conserve power. The resulting current drain is pulsed, spanning a wide dynamic range. This can be challenging for a lot of traditional equipment to accurately measure.
  • Not only is a high level of dynamic range of measurement needed for amplitude, but it is also needed on the time axis as well, for gaining deeper insights on optimizing a device’s battery run-time.
  • Over long periods of time a wireless device’s activity tends to be random in nature. Displaying and analyzing long term current drain in distribution plots can quickly and concisely display and quantify currents relating to specific activities and sub-circuits that would otherwise be difficult to directly observe in a data log.
  • The battery’s characteristics influence the current and power drawn by the device. When powering the device by other than its battery, it can be a significant source of error in testing if it does not provide results like that of when using the battery.


Going beyond evaluating and optimizing the way the device makes efficient use of its battery power, the second part, “The Battery, its End Use, and Its Management” brings out the importance of, and how to go about making certain you are getting the most of the limited amount of battery power you have available to you. Some key points for this second part include:
  • Validating the battery’s stated capacity is a crucial first step both for being certain you are getting what is expected from the battery and serve as a starting reference point that you can correlate back to the manufacturer’s data.
  • Evaluating the battery under actual end-use conditions is important as the dynamic loading a wireless device places on the battery often adversely affects the capacity obtained from the battery.
  • Charging, for rechargeable batteries, must be carefully performed under stated conditions in order to be certain of in turn getting the correct amount of capacity back out of the battery. Even very small differences in charging conditions can lead to significant differences in charge delivered during the discharge of the battery.
  • The wireless device’s battery management system (or BMS) needs to be validated for proper charging of the battery as well as suitability for addressing the particular performance needs of the device.


In Figure 1 the actual charging regiment was captured on a mobile phone battery being charged by its BMS. There turned out to be a number of notable differences in comparison to when the battery was charged using a standard charging regiment.


Figure 1: Validating BMS charge regiment on a GSM/GPRS mobile phone

If you are interested in learning more about optimizing wireless device battery run-time this two part seminar is now available on-demand at:


I think you will enjoy them!

Monday, July 9, 2012

Validating Battery Capacity for End-use Conditions


In my previous posting “Some Basics on Battery Ratings and Their Validation” I discussed the importance of making certain you are getting the most out of your battery as a key task for optimizing the battery run-time of a mobile battery powered device. You do not want to just rely on what is specified for the battery but you really need to validate it. Indeed, when I did, I found a battery’s capacity to be 12% lower than its rated value. That is a lot of unexpected loss of run-time to try to make up for! On further testing and investigation I indeed confirmed it was the battery and not something I did with inadequate charging or discharging.

Once you get a handle on the battery’s stated ratings, based on recommended charging and discharging conditions, you should then validate the capacity you are able to get under the loading conditions your device subjects the battery to. Most modern mobile battery powered devices draw high peak pulsed, low average current from the battery. Batteries subject to pulsed loading deliver less capacity in comparison to being subjected to the comparable loading that is only DC.  The amount of impact depends on the battery’s design and its ability to handle high peak pulsed loading. Furthermore two different batteries with the same ratings can deliver substantially different results in the end-use application. The bottom line is you need to validate the battery under end-use conditions to assess how much impact it has on the battery’s performance.

Creating end-use operating conditions for devices of course depends on the type of device. In some cases it may be fairly simple but in many cases it can be rather complex. A smart mobile phone, for example, requires a set up that can emulate the wireless network it normally operates in and then place it in a representative active operating state under which to run down the battery. The battery’s run down voltage and current in turn needs to be logged until the battery reaches its proper discharge termination point, in order to assess the amount of capacity it delivers under end-use conditions. An example of such a set up is shown in Figure 1.

Figure 1: End-use battery run down test set up for a mobile phone

As you are trying to assess battery capacity under end-use conditions you will likely want to run trials several times and for different batteries, you will want to control conditions as closely as possible so that you can confidently compare results knowing they were done under comparable test conditions. You also need to be careful about (not) relying on the mobile device’s internal battery management system for end-of-life discharge termination as it is a possible source of error. A technique I resorted to was to record a representative portion of the end-use pulsed current drain drawn by the mobile phone which I then “played back” continuously through our N6781A SMU, acting as an electronic load, to discharge the battery. The N6781A had the required fidelity, accuracy, and “playback” hooks to faithfully reproduce loading of the actual device.  Further details on this record and playback approach are documented in a technical overview “Simplify Validating a Battery’s Capacity and Energy for End-Use Loading Conditions”. The results of my validating the battery’s capacity under end-use conditions are shown in Figure 2.

Figure 2: End-use battery capacity validation results

In this case the battery delivered 3% less capacity under end-use pulsed loading in comparison to the results when validated using comparable DC-only loading. Here the battery appears well suited for its end-use application. Many times however, the impact can be much greater. As always, make certain to take appropriate safety precautions when working with batteries and cells.

Thursday, June 28, 2012

Some Basics on Battery Ratings and Their Validation


A key aspect of optimizing battery run-time on battery powered mobile devices is measuring and analyzing their current drain to gain greater insight on how the device is making use of its battery power and then how to make better use of it. I went into a bit of detail on this in a previous posting, “Using Current Drain Measurements to Optimize Battery Run-time of Mobile Devices”.

A second aspect of optimizing battery run-time is making certain you are making optimum use of the battery powering the device. This starts with understanding and validating the battery’s stated capacity and energy ratings. Simply assuming the battery meets or exceeds its stated ratings without validating them is bound to leave you coming up shorter than expected on run-time.  It is critical that you validate them per the manufacturer’s recommended conditions. This serves as a starting point of finding out what you can ultimately expect from the battery you intend to use in your device. More than likely constraints imposed by the nature of your device and its operating conditions and requirements will further reduce the amount of capacity you can expect from the battery in actual use.

A battery’s capacity rating is the total amount of charge the battery can deliver. It is product of the current it can deliver over time, stated as ampere-hours (Ah) or miiliampere-hours (mAh). Alternately the charge rating is also stated as coulombs (C), where:
·         1 coulomb (C)= 1 ampere-sec
·         1 ampere-hour (Ah)= 3,600 coulombs

A battery’s energy rating is the total amount of energy the battery can deliver. It is the product of the power it can deliver over time, stated as watt-hours (Wh) or milliwatt-hours (mWh). It is also the product of the battery’s capacity (Ah) and voltage (V). Alternately the energy rating is also stated as joules (J) where:
·         1 joule (J)= 1 watt-second
·         1 watt-hour (Wh) = 3,600 joules

One more fundamental parameter relating to a battery’s capacity and energy ratings is the C rate or charge (or discharge) rate. This is the ratio of the level of current being furnished (or drawn from, when discharging) the battery, to the battery’s capacity, where:
·         C rate (C) = current (A) / (capacity (Ah)
·         C rate (C) = 1 / charge or discharge time

It is interesting to note while “C” is used to designate units of C rate, the units are actually 1/h or h-1. The type of battery and its design has a large impact on the battery’s C rate. Batteries for power tools have a high C rate capability of 10C or greater, for example, as they need to deliver high levels of power over short periods of time. More often however is that many batteries used in portable wireless mobile devices need to run for considerably longer and they utilize batteries having relatively low C rates. A battery’s capacity is validated with a C rate considerably lower than it is capable of as when the C rate is increased the capacity drops due to losses within the battery itself.

Validating a battery’s capacity and energy ratings requires logging the battery’s voltage and current over an extended period of time, most often with a regulated constant current load. An example of this for a lithium ion cell is shown in Figure 1 below. Capacity was found to be 12% lower than its rating.

Figure 1: Measuring a battery’s capacity and energy

Additional details on this can be found in a technical overview I wrote, titled “Simply Validating a Battery’s Capacity and Energy Ratings”. As always, proper safety precautions always be observed when working with batteries and cells. Validating the battery’s stated capacity and energy ratings is the first step. As the battery is impacted by the device it is powering, it must then be validated under its end-use conditions as well. Stay tuned!

Wednesday, June 20, 2012

Battery drain analysis of handheld HP 973A multimeter

I have owned a Hewlett-Packard 973A multimeter for longer than I can remember. What has always amazed me about this meter is that I have never had to change the batteries in it! It runs off of 2 AA batteries (in series, of course), and earlier this week, I had to open it up to change a blown fuse for the mA/uA current measurement input (that’s what I get for lending the meter to someone).


While I had it open, I took a look at the AA batteries and was surprised to see a date code of 04-99. That means these batteries have been powering this multimeter for at least 13 years! I admit that I don’t use the meter very frequently, but I am still impressed with how long these batteries lasted. The series combination measured about 2.6 V – still plenty of charge left to power the multimeter (2 new batteries in series measure about 3.2 V).


Since we make power supplies that can perform battery drain analysis, I decided to take a quick look at the current drawn by the multimeter from these batteries. I used an Agilent N6705B mainframe with an N6781A Source/Measure Unit (SMU) installed. This SMU has many features that make it easy to analyze current drain. For example, I set the SMU for Current Measure mode which means it acts like a zero-burden ammeter (an ammeter with no voltage drop across the inputs). I found that the multimeter (set to measure DC V) draws about 3.5 mA from the 2.6 V series combination of AA batteries. I used both the Meter View feature of the SMU and the Data Logger to verify the current. The Data Logger shows the dynamic current being drawn from the batteries and I measured the average current between the markers.


Typical AA batteries are rated for about 2500 mA-hours, so with a 3.5 mA load, they will last more than 700 hours. It is no wonder that the batteries lasted a long time; I use this meter only a few hours per month, so assuming 3 hours per month, the batteries would last about 20 years!

While I had the back cover off, I removed the batteries and powered the multimeter directly from the N6781A SMU. I could then slowly lower the voltage and find when the low battery indicator came on. This happened at about 2.3 V. Continuing to lower the voltage, the LCD display continued to work down to almost 1.0 V. I also noticed that the current drawn by the multimeter increased as the voltage decreased – the multimeter was drawing a nearly constant amount of power from the source – roughly 9 to 10 mW.


I figured while I had the multimeter open, I might as well install new batteries. I doubt I will write another post the next time these batteries need to be replaced in 20 to 30 years, but keep checking here.… you never know!