Showing posts with label measure battery current. Show all posts

Thursday, November 15, 2012

Validating battery capacity under end-use conditions for battery powered mobile devices


One aspect (of many) I have talked about for optimizing battery life for battery powered mobile devices is assessing the battery’s actual capacity. Not only do you need to assess its capacity under conditions as stated by the manufacturer but also under conditions reflecting actual end use.

Validating the battery under a manufacturer’s stated conditions establish a starting point of what you might be achievable in how much capacity you can obtain from the battery and if it is in line with what the manufacturer states. Sometime it can be less for a variety of reasons. Even subtle differences in stated conditions can lead to fairly substantial differences in capacity. The stated conditions usually provide a “best case” achievable value for capacity. Do not be surprised if your results for the battery’s capacity fall a little short of the best case value provided by the manufacturer. With a little work you may be able to determine what subtle difference caused it, or simply, the best case value given is a bit optimistic.

Validating the battery under end-use conditions helps establish the difference you can expect between the battery’s capacity for rather ideal stated conditions against end-use conditions. Battery powered mobile devices draw current in a pulsed fashion, with high peaks in relation to the overall average current drain. An example of this kind of dynamic current drain is shown in Figure 1. In this case it is the active mode current drain of a GPRS smart mobile phone.


Figure 1: GPRS smart mobile phone dynamic current drain waveform

This usually significantly degrades the battery’s delivered capacity in comparison to the manufacturer’s stated conditions, which are based on a constant DC current discharge. If you do not take the impact of end-use loading conditions on the battery’s capacity into account there is a good chance the mobile device’s run-time will fall quite a bit short of expectations.

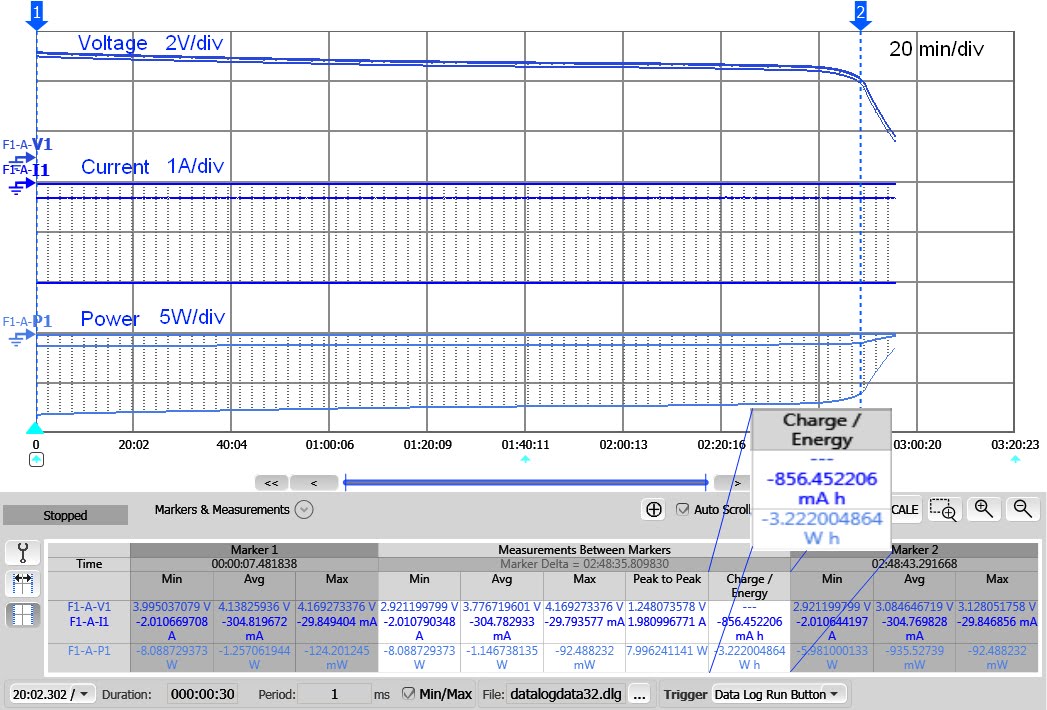
The usual way to validate a battery’s capacity under end-use conditions is to actually hook the battery together with its device, connect up logging instrumentation for recording the battery run down voltage and current over time, and then placing the device in a desired operating mode and let it run until the battery is run down. While a battery run-down test like this is useful to do it has a couple of issues when trying to focus explicitly on just the battery:
  • It is a test of the combination of the battery together with its host device. The host device also has influence on the test’s outcome and must be taken into account in assessing just the battery under end-use.
  • It can often be complex and difficult to set up the device in its desired operating condition, requiring a substantial amount of supporting equipment to recreate its environment for providing a realistic operating condition.
  • It can sometimes be difficult to get consistently repeatable results with the actual device.

An alternative to repeatedly using the actual device is to use an electronic load that can draw a dynamic current representative of the actual device the electronic load is being used in place of. In some cases a simple low duty cycle, high crest factor pulsed current waveform can be directly programmed into the electronic load. In cases where the host device’s current drain waveform is a bit more complex it may be useful to have an electronic load that is able to “play back” a digitized waveform file that is a representative portion of the device’s actual current drain, on an ongoing basis to run down the battery. As one example we put features into our 14585A software to simplify this record and playback approach using our N6781A 2-quadrant DC source measure module. This set up is depicted in Figure 2.


Figure 2: Current drain record and playback set up using the 14585 and N6781A

In the first half of this process the N6781A serves as a voltage source to power up the device while digitizing its dynamic current drain waveform. In the second half of this process the captured current drain waveform is inverted and then played back by the N6781A now instead operating as a constant current load connected to a battery to discharge it. A colleague in our office recently completed a video of how to do this record and playback process using a digital camera as an example, capturing the current drain waveform of the process of taking a picture. This could be played back repeatedly to determine how many pictures could be taken with a set of batteries, for example. I know with my digital camera I need to take a spare set of batteries with me as it uses up batteries quite quickly! The video is available to be viewed at the following link:“record and playback video”

Monday, July 9, 2012

Validating Battery Capacity for End-use Conditions


In my previous posting “Some Basics on Battery Ratings and Their Validation” I discussed the importance of making certain you are getting the most out of your battery as a key task for optimizing the battery run-time of a mobile battery powered device. You do not want to just rely on what is specified for the battery but you really need to validate it. Indeed, when I did, I found a battery’s capacity to be 12% lower than its rated value. That is a lot of unexpected loss of run-time to try to make up for! On further testing and investigation I indeed confirmed it was the battery and not something I did with inadequate charging or discharging.

Once you get a handle on the battery’s stated ratings, based on recommended charging and discharging conditions, you should then validate the capacity you are able to get under the loading conditions your device subjects the battery to. Most modern mobile battery powered devices draw high peak pulsed, low average current from the battery. Batteries subject to pulsed loading deliver less capacity in comparison to being subjected to the comparable loading that is only DC.  The amount of impact depends on the battery’s design and its ability to handle high peak pulsed loading. Furthermore two different batteries with the same ratings can deliver substantially different results in the end-use application. The bottom line is you need to validate the battery under end-use conditions to assess how much impact it has on the battery’s performance.

Creating end-use operating conditions for devices of course depends on the type of device. In some cases it may be fairly simple but in many cases it can be rather complex. A smart mobile phone, for example, requires a set up that can emulate the wireless network it normally operates in and then place it in a representative active operating state under which to run down the battery. The battery’s run down voltage and current in turn needs to be logged until the battery reaches its proper discharge termination point, in order to assess the amount of capacity it delivers under end-use conditions. An example of such a set up is shown in Figure 1.

Figure 1: End-use battery run down test set up for a mobile phone

As you are trying to assess battery capacity under end-use conditions you will likely want to run trials several times and for different batteries, you will want to control conditions as closely as possible so that you can confidently compare results knowing they were done under comparable test conditions. You also need to be careful about (not) relying on the mobile device’s internal battery management system for end-of-life discharge termination as it is a possible source of error. A technique I resorted to was to record a representative portion of the end-use pulsed current drain drawn by the mobile phone which I then “played back” continuously through our N6781A SMU, acting as an electronic load, to discharge the battery. The N6781A had the required fidelity, accuracy, and “playback” hooks to faithfully reproduce loading of the actual device.  Further details on this record and playback approach are documented in a technical overview “Simplify Validating a Battery’s Capacity and Energy for End-Use Loading Conditions”. The results of my validating the battery’s capacity under end-use conditions are shown in Figure 2.

Figure 2: End-use battery capacity validation results

In this case the battery delivered 3% less capacity under end-use pulsed loading in comparison to the results when validated using comparable DC-only loading. Here the battery appears well suited for its end-use application. Many times however, the impact can be much greater. As always, make certain to take appropriate safety precautions when working with batteries and cells.

Wednesday, June 20, 2012

Battery drain analysis of handheld HP 973A multimeter

I have owned a Hewlett-Packard 973A multimeter for longer than I can remember. What has always amazed me about this meter is that I have never had to change the batteries in it! It runs off of 2 AA batteries (in series, of course), and earlier this week, I had to open it up to change a blown fuse for the mA/uA current measurement input (that’s what I get for lending the meter to someone).


While I had it open, I took a look at the AA batteries and was surprised to see a date code of 04-99. That means these batteries have been powering this multimeter for at least 13 years! I admit that I don’t use the meter very frequently, but I am still impressed with how long these batteries lasted. The series combination measured about 2.6 V – still plenty of charge left to power the multimeter (2 new batteries in series measure about 3.2 V).


Since we make power supplies that can perform battery drain analysis, I decided to take a quick look at the current drawn by the multimeter from these batteries. I used an Agilent N6705B mainframe with an N6781A Source/Measure Unit (SMU) installed. This SMU has many features that make it easy to analyze current drain. For example, I set the SMU for Current Measure mode which means it acts like a zero-burden ammeter (an ammeter with no voltage drop across the inputs). I found that the multimeter (set to measure DC V) draws about 3.5 mA from the 2.6 V series combination of AA batteries. I used both the Meter View feature of the SMU and the Data Logger to verify the current. The Data Logger shows the dynamic current being drawn from the batteries and I measured the average current between the markers.


Typical AA batteries are rated for about 2500 mA-hours, so with a 3.5 mA load, they will last more than 700 hours. It is no wonder that the batteries lasted a long time; I use this meter only a few hours per month, so assuming 3 hours per month, the batteries would last about 20 years!

While I had the back cover off, I removed the batteries and powered the multimeter directly from the N6781A SMU. I could then slowly lower the voltage and find when the low battery indicator came on. This happened at about 2.3 V. Continuing to lower the voltage, the LCD display continued to work down to almost 1.0 V. I also noticed that the current drawn by the multimeter increased as the voltage decreased – the multimeter was drawing a nearly constant amount of power from the source – roughly 9 to 10 mW.


I figured while I had the multimeter open, I might as well install new batteries. I doubt I will write another post the next time these batteries need to be replaced in 20 to 30 years, but keep checking here.… you never know!

Wednesday, March 21, 2012

Using Current Drain Measurements to Optimize Battery Run-time of Mobile Devices

One power-related application area I do a great deal of work on is current drain measurements and analysis for optimizing the battery run-time of mobile devices. In the past the most of the focus has been primarily mobile phones. Currently 3G, 4G and many other wireless technologies like ZigBee continue to make major inroads, spurring a plethora of new smart phones, wireless appliances, and all kinds of ubiquitous wireless sensors and devices. Regardless of whether the device is overly power-hungry due to running data-intensive applications or power-constrained due to its ubiquitous nature, there is a need to optimize its thirst for power in order to get the most run-time from its battery. The right kind of measurements and analysis on the device’s current drain can yield a lot of insight on the device’s operation and efficiency of its activities that are useful for the designer in optimizing its battery run-time. I recently completed an article that appeared in Test & Measurement World, on-line back in November and then in print in their Dec 2011- Jan 2012 issue. Here is a link to the article:
http://www.tmworld.com/article/520045-Measurements_optimize_battery_run_time.php

A key factor in getting current drain measurements to yield the deeper insights that really help optimize battery run-time is the dynamic range of measurement, both in amplitude and in time, and then having the ability to analyze the details of these measurements. The need for a great dynamic range of measurement stems from the power-savings nature of today’s wireless battery powered devices. For power-savings it is much more efficient for the device to operate in short bursts of activities, getting as much done as possible in the shortest period of time, and then go into a low power idle or sleep state for an extended period of time between these bursts of activities. Of course the challenge for the designer to get his device to quickly wake up, stabilize, do its thing, and then just as quickly go back to sleep again is no small feat! As one example the current drain of a wireless temperature transmitter for its power-savings type of operation is shown in Figure 1.


Figure 1: Wireless temperature transmitter power-savings current drain

The resulting current drain is pulsed. The amplitude scale has been increased to 20 µA/div to show details of the signal’s base. This particular device’s current drain has the following characteristics:
• Period of ~4 seconds
• Duty cycle of 0.17%
• Currents of 21.8 mA peak and 53.7 µA average for a crest factor of ~400
• Sleep current of 7 µA
This extremely wide dynamic range of amplitude is challenging to measure as it spans about 3 ½ decades. Both DC offset error and noise floors of the measurement equipment must be extremely low as to not limit needed accuracy and obscure details.

Likewise being able to examine details of the current drain during the bursts of activities provides insights about the duration and current drain level of specific operations within the burst. From this you can make determinations about efficiencies of the operations and if there is opportunity to further optimize them. As an example, in standby operation a mobile phone receives in short bursts about every 0.25 to 1 seconds to check for incoming pages and drops back into a sleep state in between the receive (RX) bursts. An expanded view of one of the RX current drain bursts is shown in figure 2.


Figure 2: GPRS mobile phone RX burst details

There are a number of activities taking place during the RX burst. Having sufficient measurement bandwidth and sampling time resolution down to 10’s of µsec provides the deeper insight needed for optimizing these activities. The basic time period for the mobile phone standby operation is on the order of a second but it is usually important to look at the current drain signal over an extended period of time due to variance of activities that can occur during each of the RX bursts. Having either a very deep memory, or even better, high speed data logging, provides the dynamic range in time to get 10’s of µsec of resolution over an extended period of time, so that you can determine overall average current drain while also being able to “count the coulombs” it takes for individual, minute operations, and optimize their efficiencies.

Anticipate seeing more here in future posts about mobile wireless battery-powered devices, as it relates to the “DC” end of the spectrum. In the meantime, while you are using your smart phone or tablet and battery life isn’t quite meeting your expectation (or maybe it is!), you should also marvel at how capable and compact your device is and how far it has come along in contrast to what was the state-of-the-art 5 and 10 years ago!

Friday, February 17, 2012

The economics of recharging your toy helicopter

While on a business trip visiting customers in Taiwan back in December, I got a toy helicopter as a thank-you gift from one of my coworkers (thanks, Sharon!). This toy helicopter is fun to fly and is surprisingly stable in the air.


Flight time is about 7 minutes, and the battery recharge time is about 40 minutes. It can be recharged from a powered USB port by using a wire that came with the toy that has a USB connector on one end and the helicopter charging connector on the other end. Or, it can be recharged from the six AA alkaline batteries inside the handheld controller via a wire that exits from the controller. Thinking I did not want to prematurely drain the controller batteries, I typically used the USB charging method by using my iPad’s 10 W USB power adapter plugged into a wall outlet. So I got to thinking about which charging method was more economical: charging from a wall outlet or from the batteries. Luckily, I have test equipment at my disposal that can help me answer that question!


Recharging using AC power via USB power adapter
Using one of our Agilent 6812B AC sources, I captured the AC power used during a recharge cycle. I used the AC source GUI to take readings of power every second for the charge period and plotted it in a spreadsheet (graph shown below). I found that the power consumed started at about 2.2 W and ended at about 1.2 W roughly 41 minutes later. The energy used during this time was 1.1 W-hours. Where I live in New Jersey, the utility company charges about 15 cents per kilowatt-hour, so 1.1 W-hours of energy used to charge the helicopter costs fractions of a penny (0.0165 cents = US$ 0.000165). This is basically nothing!


Recharging using controller battery power
To analyze the current drawn from the controller batteries, I used one of our Agilent N6705B DC power analyzers with an N6781A SMU module installed. I ran the battery current path through the SMU set for Current Measure mode and used our 14585A Control and Analysis software. I captured the current drawn from the six AA batteries in the controller during the helicopter recharge cycle. These batteries are in series, so the same current flows through each of the six batteries and also through the SMU for my test.


For the recharge period (about 43 minutes using this method), the software shows the batteries provided 173 mA-hours of charge to the helicopter. A typical AA alkaline battery is rated for 2500 mA-hours, so that means I would get about 14 (= 2500/173) charge cycles from these six batteries. If you shop around for high-quality AA batteries, you might find them for as low as 25 cents per battery. Since the controller takes six of these, the battery cost for the controller is $1.50. If I can recharge the helicopter 14 times with $1.50 worth of batteries, each recharge cycle costs about 10.7 cents (= US$ 0.107). This is 650 times more expensive than using the AC power method, so I will continue using the wall outlet to recharge my toy helicopter! How about you?
Note that with the AC power recharge method, you pay for the kilowatt-hours you consume from your utility company. With the controller battery power method, you pay for the mA-hours you consume from your batteries. Consider this: if you choose the AC power method, you will save US$ 0.106835 per recharge cycle. That means after just 2.81 million recharge cycles, you will have saved enough money to buy yourself a real helicopter worth US$ 300,000, so you better get started now!