Showing posts with label battery charging. Show all posts

Friday, July 24, 2015

“Adaptive Fast Charging” for faster charging of mobile devices

In some of my previous posts I have talked about USB power delivery 2.0 providing greater power so that mobile devices can be charged up more quickly with their USB adapters.  A key part of this is these devices are incorporating adaptive fast charging systems to accomplish faster charging. So how does this all work anyway?

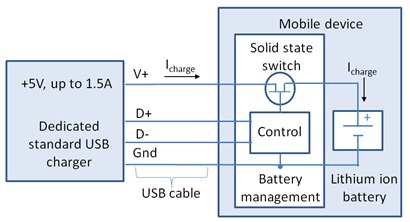
Let’s first look at the way existing USB charging work, depicted in Figure 1.


Figure 1: Legacy standard USB charging system

When the mobile device is connected to the USB adapter, the mobile device first determines what kind of USB port it is connected to and how much charging current is available that it will be able to draw in order to recharge its battery. The mobile device then proceeds to internally connect its battery up to the USB power through an internal solid state switch that regulates the charging via the device’s internal battery management. However, a major limitation here is the amount of available current and power. Today’s mobile devices are using larger batteries. Up to 4 Ah batteries are commonly used in smart phones and over 9 Ah capacity batteries are being used in tablets. Even with later updates that increased the charging current to 1.5 amps for a dedicated charging port, this is a small fraction of the charging current and power these larger batteries can handle. As one example, a 9 Ah battery having a 1C recommended maximum charging rate equates to a 9 amp charging current. This requires overnight in order to significantly recharge the battery using standard USB charging.

The shortcomings of legacy USB for battery charging purposes has been well recognized and the USB Power Delivery 2.0 specification has been released to increase the amount of power available to as much as 100 watts. This is accomplished by greater voltage, up to 20 volts, and greater current, up to 5 amps. For a mobile device incorporating this, together with an adaptive fast charging system, is able to charge its battery in much less time. This set up is depicted in Figure 2.


Figure 2: USB adaptive fast charging system

With adaptive fast charging, when the mobile device is connected to the USB adapter, after determining that it has compatible fast charging capabilities, it then negotiates for higher voltage and power. After the negotiation the adapter then increases its output accordingly. A key thing here is the mobile device will typically incorporate DC/DC power conversion in its battery management system. Here it will efficiently convert the adapter’s higher voltage charging power into greater charging current at a voltage level comparable to the mobile device’s battery voltage, to achieve much faster charging. Now you will be able to recharge your device over lunch instead of overnight!

Wednesday, May 20, 2015

Updates to USB provide higher power and faster charging

For those who regularly visit our blog here are already aware I do a fair amount of work with regard to test methodologies for optimizing battery life on mobile wireless devices. One directly related topic I have been actively investigating these past few months is the battery charging aspects for these devices. Recharging the battery on these devices takes a considerable amount of time; typically a couple of hours or longer, and it’s only been getting worse. However, there has been a lot of work, activity, and even new product developments that are making dramatic improvements in recharging your devices’ batteries in less time!

The USB port has become the universal connection for providing charging power for mobile devices. When initially available a USB port could provide up to 500 mA for general power for peripheral devices. It was recognized that this was also a convenient source for charging portable devices but that more current was needed. The USB BC (battery charging) standard was established which formalized charging initially for up to 1.5 amps at 5 volts.

This higher charging current and power was alright for mobile devices of a couple of generations ago, but today’s smart phones, tablets, and phablets are using much larger and higher capacity batteries. The end result is, because USB is 5 volts its power thus limited to 7.5W, that it can take several hours to recharge a device’s battery.  This can be very inconvenient if your battery goes dead during the day!

Simply increasing the USB current is not a total answer as this has limitations. First, the micro USB connectors on mobile devices are rated for no more than about 1.8 to 2 amps. To help on this front there is the new USB Type-C cable and connector specification released last year. The new type-C micro connectors are able to handle up to 3 amps and the standard connectors able to handle up to 5 amps. Higher current alone is not quite enough. Also issued last year was the new USB Power Delivery 2.0 specification. This specifies a system capable of providing up to 20 volts and 5 amps. This is more than order of magnitude improvement in power over the existing USB power. Long charging times due to power limitations will become a thing of the past.

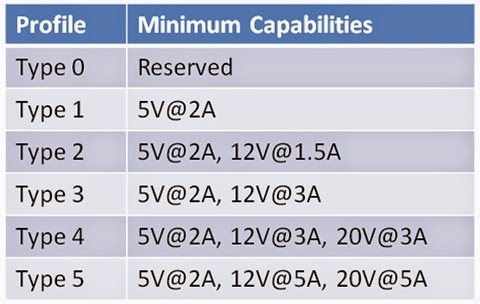
The new USB power delivery voltages and currents are a discrete set of levels as shown in table 1. As can be seen the levels depend on the profile/port designation.


Table 1: USB power delivery 2.0 voltage and current levels

The cables and connectors of course need to be able to handle the given level of current and power.  In review of the standard a lot of work and effort has gone into providing this new capability while maintaining compatibility with the past as well. Thus for a new mobile device to take advantage of these higher power levels, it must be capable of negotiating with the charging power port to furnish it. At the same time, if an earlier generation mobile device is connected, it will only be able to get the default USB 5 volt level.


I’m looking forward to seeing this new USB power delivery put into wide-spread use in various innovative new products. Expect to see more about this topic in future posts from me here!

Thursday, August 8, 2013

Zero-burden ammeter improves battery run-down and charge management testing of battery-powered devices

One way of assessing run-time of battery-powered devices is to power them up with a regulated DC source, place the device into its appropriate operating modes, and get the corresponding current drawn by the device for each of the various operating modes. Estimations of battery run-time can then be made for different user types, based on the percentage of time spent in each of these operating modes, and the capacity of the battery in mA-hours. The DC source must be able to maintain a stable, transient free voltage at the DUT. A lot of general purpose power supplies have difficulty with mobile wireless devices that draw fast rising, high peak currents. Providing the regulated DC source meets maintains a stable voltage, it offers some advantages, including:
  • Maintains a fixed voltage level over time, removing variability due to changing voltage.
  • Using built-in current read-back eliminates voltage drop issues encountered with using a resistive shunt. This is problematic with mobile wireless devices that draw high peak, but low average current.


An alternative to using a regulated DC source to power the battery powered device is instead use the actual battery. Just like with using a DC source, one can make representative current drain measurements over shorter periods for all the various operating modes and then make predictions on run-time. Alternately one can also perform actual battery run-down tests which, when performed correctly, yields quite a few more insights beyond representative current drain measurements, such as:
  • Low battery discharge termination details.
  • Battery capacity and energy actually delivered.
  • Actual run time achieved.
  • How well the battery and device work together as a system


An actual battery-run down test is an indispensable part of validation as a final proof of performance.

Just as with evaluating battery run-down, it is also just as important to evaluate battery charging and management. Again, a lot of testing can be done on a device independent of its battery, but there is also a lot of additional value in validating a device’s charge management performance with its actual battery.

When validating a device’s discharging and charging performance with an actual battery, the first test challenge is the current drawn from or sourced to the battery needs to be accurately measured and logged over time, together with the battery’s voltage, for making good capacity and energy measurements. The second test challenge here is you cannot afford to introduce any significant drop in voltage between the device and its battery, as this alters charging and discharging performance of the battery powered device. This can be a real problem when trying to use shunt resistors.

An alternative is to use a zero-burden ammeter. You may ask how an ammeter can be zero-burden. It has to have some resistance in order to produce a measurable value, right? Well, not always. Agilent provides an innovative alternative use of the N6781A 2-quadrant source measure module that enables it to operate as a zero-burden ammeter (in addition to being a DC source). Using the N6781A as a zero-burden ammeter to evaluate battery run-down and battery charging of a battery-powered device is depicted in Figure 1.


Figure 1: N6781A zero-burden ammeter / wattmeter operation

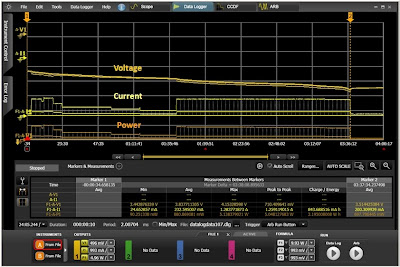
The N6781A is able to operate as a zero-burden ammeter because it is able to actively regulate its output at zero volts independent of the current flowing through it. Because its output is zero volts, when placed in series between the device and its battery, there is no voltage drop. At the same time its precision current measurement system is able to now measure the discharge or charge currents. In addition a separate voltage measurement port allows it to measure the battery voltage, so now you are able to capture the battery’s discharge or charge voltage profile, as well as determine charge in amp-hours and energy in watt-hours, as shown in Figure 2.


Figure 2: Capturing, displaying, and evaluating battery run-down results with 14585A software

A useful reference providing further details on evaluating a device’s battery run-down and charging, and how to configure and use the N6781A as a zero-burden ammeter are available in our application note; “Evaluating Battery Run-Down with the N6781A 2-Quadrant Source Measure Unit and the 14585A Control and Analysis Software” (click here to access).

Monday, September 24, 2012

Optimizing Mobile Device Battery Run-time Seminars


On many occasions in the past here both I, and my colleague, Gary, have written about measuring, evaluating, and optimizing battery life of mobile wireless battery powered devices. There is no question that, as all kinds of new and innovative capabilities and devices are introduced; battery life continues to become an even greater challenge.

I recently gave a two-part webcast entitled “Optimize Wireless Device Battery Run-time”. In the first part “Innovative Measurements for Greater Insights” a variety of measurement techniques are employed on a number of different wireless devices to illustrate the nature of how these devices operate and draw power from their batteries over time, and in turn how to go about making and analyzing the measurements to improve the device’s battery run-time. Some key points brought out in this first part include:
  • Mobile devices operate in short bursts of activities to conserve power. The resulting current drain is pulsed, spanning a wide dynamic range. This can be challenging for a lot of traditional equipment to accurately measure.
  • Not only is a high level of dynamic range of measurement needed for amplitude, but it is also needed on the time axis as well, for gaining deeper insights on optimizing a device’s battery run-time.
  • Over long periods of time a wireless device’s activity tends to be random in nature. Displaying and analyzing long term current drain in distribution plots can quickly and concisely display and quantify currents relating to specific activities and sub-circuits that would otherwise be difficult to directly observe in a data log.
  • The battery’s characteristics influence the current and power drawn by the device. When powering the device by other than its battery, it can be a significant source of error in testing if it does not provide results like that of when using the battery.


Going beyond evaluating and optimizing the way the device makes efficient use of its battery power, the second part, “The Battery, its End Use, and Its Management” brings out the importance of, and how to go about making certain you are getting the most of the limited amount of battery power you have available to you. Some key points for this second part include:
  • Validating the battery’s stated capacity is a crucial first step both for being certain you are getting what is expected from the battery and serve as a starting reference point that you can correlate back to the manufacturer’s data.
  • Evaluating the battery under actual end-use conditions is important as the dynamic loading a wireless device places on the battery often adversely affects the capacity obtained from the battery.
  • Charging, for rechargeable batteries, must be carefully performed under stated conditions in order to be certain of in turn getting the correct amount of capacity back out of the battery. Even very small differences in charging conditions can lead to significant differences in charge delivered during the discharge of the battery.
  • The wireless device’s battery management system (or BMS) needs to be validated for proper charging of the battery as well as suitability for addressing the particular performance needs of the device.


In Figure 1 the actual charging regiment was captured on a mobile phone battery being charged by its BMS. There turned out to be a number of notable differences in comparison to when the battery was charged using a standard charging regiment.


Figure 1: Validating BMS charge regiment on a GSM/GPRS mobile phone

If you are interested in learning more about optimizing wireless device battery run-time this two part seminar is now available on-demand at:


I think you will enjoy them!

Monday, July 9, 2012

Validating Battery Capacity for End-use Conditions


In my previous posting “Some Basics on Battery Ratings and Their Validation” I discussed the importance of making certain you are getting the most out of your battery as a key task for optimizing the battery run-time of a mobile battery powered device. You do not want to just rely on what is specified for the battery but you really need to validate it. Indeed, when I did, I found a battery’s capacity to be 12% lower than its rated value. That is a lot of unexpected loss of run-time to try to make up for! On further testing and investigation I indeed confirmed it was the battery and not something I did with inadequate charging or discharging.

Once you get a handle on the battery’s stated ratings, based on recommended charging and discharging conditions, you should then validate the capacity you are able to get under the loading conditions your device subjects the battery to. Most modern mobile battery powered devices draw high peak pulsed, low average current from the battery. Batteries subject to pulsed loading deliver less capacity in comparison to being subjected to the comparable loading that is only DC.  The amount of impact depends on the battery’s design and its ability to handle high peak pulsed loading. Furthermore two different batteries with the same ratings can deliver substantially different results in the end-use application. The bottom line is you need to validate the battery under end-use conditions to assess how much impact it has on the battery’s performance.

Creating end-use operating conditions for devices of course depends on the type of device. In some cases it may be fairly simple but in many cases it can be rather complex. A smart mobile phone, for example, requires a set up that can emulate the wireless network it normally operates in and then place it in a representative active operating state under which to run down the battery. The battery’s run down voltage and current in turn needs to be logged until the battery reaches its proper discharge termination point, in order to assess the amount of capacity it delivers under end-use conditions. An example of such a set up is shown in Figure 1.

Figure 1: End-use battery run down test set up for a mobile phone

As you are trying to assess battery capacity under end-use conditions you will likely want to run trials several times and for different batteries, you will want to control conditions as closely as possible so that you can confidently compare results knowing they were done under comparable test conditions. You also need to be careful about (not) relying on the mobile device’s internal battery management system for end-of-life discharge termination as it is a possible source of error. A technique I resorted to was to record a representative portion of the end-use pulsed current drain drawn by the mobile phone which I then “played back” continuously through our N6781A SMU, acting as an electronic load, to discharge the battery. The N6781A had the required fidelity, accuracy, and “playback” hooks to faithfully reproduce loading of the actual device.  Further details on this record and playback approach are documented in a technical overview “Simplify Validating a Battery’s Capacity and Energy for End-Use Loading Conditions”. The results of my validating the battery’s capacity under end-use conditions are shown in Figure 2.

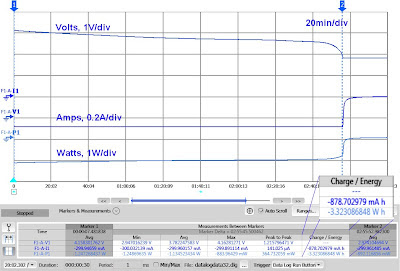
Figure 2: End-use battery capacity validation results

In this case the battery delivered 3% less capacity under end-use pulsed loading in comparison to the results when validated using comparable DC-only loading. Here the battery appears well suited for its end-use application. Many times however, the impact can be much greater. As always, make certain to take appropriate safety precautions when working with batteries and cells.

Thursday, June 28, 2012

Some Basics on Battery Ratings and Their Validation


A key aspect of optimizing battery run-time on battery powered mobile devices is measuring and analyzing their current drain to gain greater insight on how the device is making use of its battery power and then how to make better use of it. I went into a bit of detail on this in a previous posting, “Using Current Drain Measurements to Optimize Battery Run-time of Mobile Devices”.

A second aspect of optimizing battery run-time is making certain you are making optimum use of the battery powering the device. This starts with understanding and validating the battery’s stated capacity and energy ratings. Simply assuming the battery meets or exceeds its stated ratings without validating them is bound to leave you coming up shorter than expected on run-time.  It is critical that you validate them per the manufacturer’s recommended conditions. This serves as a starting point of finding out what you can ultimately expect from the battery you intend to use in your device. More than likely constraints imposed by the nature of your device and its operating conditions and requirements will further reduce the amount of capacity you can expect from the battery in actual use.

A battery’s capacity rating is the total amount of charge the battery can deliver. It is product of the current it can deliver over time, stated as ampere-hours (Ah) or miiliampere-hours (mAh). Alternately the charge rating is also stated as coulombs (C), where:
·         1 coulomb (C)= 1 ampere-sec
·         1 ampere-hour (Ah)= 3,600 coulombs

A battery’s energy rating is the total amount of energy the battery can deliver. It is the product of the power it can deliver over time, stated as watt-hours (Wh) or milliwatt-hours (mWh). It is also the product of the battery’s capacity (Ah) and voltage (V). Alternately the energy rating is also stated as joules (J) where:
·         1 joule (J)= 1 watt-second
·         1 watt-hour (Wh) = 3,600 joules

One more fundamental parameter relating to a battery’s capacity and energy ratings is the C rate or charge (or discharge) rate. This is the ratio of the level of current being furnished (or drawn from, when discharging) the battery, to the battery’s capacity, where:
·         C rate (C) = current (A) / (capacity (Ah)
·         C rate (C) = 1 / charge or discharge time

It is interesting to note while “C” is used to designate units of C rate, the units are actually 1/h or h-1. The type of battery and its design has a large impact on the battery’s C rate. Batteries for power tools have a high C rate capability of 10C or greater, for example, as they need to deliver high levels of power over short periods of time. More often however is that many batteries used in portable wireless mobile devices need to run for considerably longer and they utilize batteries having relatively low C rates. A battery’s capacity is validated with a C rate considerably lower than it is capable of as when the C rate is increased the capacity drops due to losses within the battery itself.

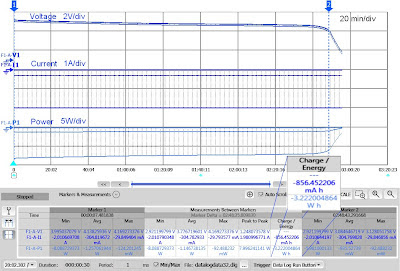
Validating a battery’s capacity and energy ratings requires logging the battery’s voltage and current over an extended period of time, most often with a regulated constant current load. An example of this for a lithium ion cell is shown in Figure 1 below. Capacity was found to be 12% lower than its rating.

Figure 1: Measuring a battery’s capacity and energy

Additional details on this can be found in a technical overview I wrote, titled “Simply Validating a Battery’s Capacity and Energy Ratings”. As always, proper safety precautions always be observed when working with batteries and cells. Validating the battery’s stated capacity and energy ratings is the first step. As the battery is impacted by the device it is powering, it must then be validated under its end-use conditions as well. Stay tuned!

Wednesday, March 28, 2012

What Is Going On When My Power Supply Displays “UNR”?

Most everyone is familiar with the very traditional Constant Voltage (CV) and Constant Current (CC) operating modes incorporated in most any lab bench or system power supply. All but the most very basic power supplies provide display indicators or annunciators to indicate whether it is in CV or CC mode. However, moderately more sophisticated power supplies provide additional indicators or annunciators to provide increased insight and more information about their operating status. One annunciator you may encounter is seeing “UNR” flash on, either momentarily or continuously. It’s fairly obvious that this means that the power supply is unregulated; it is failing to maintain a Constant Voltage or Constant Current. But what is really going on when the power supply displays UNR and what things might cause this?
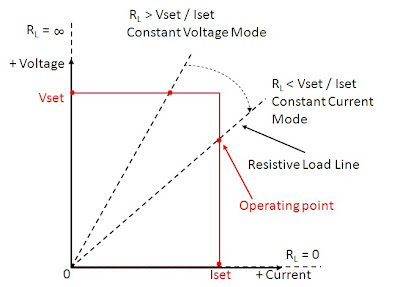
To gain better insight about CV, CC and UNR operating modes it is helpful to visualize what is going on with an IV graph of the power supply output in combination with the load line of the external device being powered. I wrote a two part post about voltage and current levels and limits which you may find useful to review. If you like you can access it from these links levels and limits part 1 and levels and limits part 2. This posting builds nicely on these earlier postings. A conventional single quadrant power supply IV graph with resistive load line is depicted in Figure 1. As the load resistance varies from infinity to zero the power supply’s output goes through the full range of CV mode through CC mode operation. With a passive load like a resistor you are unlikely to encounter UNREG mode, unless perhaps something goes wrong in the power supply itself.
Figure 1: Single quadrant power supply IV characteristic with a resistive load

However, with active load devices you have a pretty high chance of encountering UNR mode operation, depending where the actual voltage and current values end up at in comparison to the power supply’s voltage and current settings. One common application where UNR can be easily encountered is charging a battery (our external active load device) with a power supply. Two different scenarios are depicted in Figure 2. For scenario 1, when the battery voltage is less than the power supply’s output, the point where the power supply’s IV characteristic curve and the battery’s load line (a CV characteristic) intersect, the power supply is in CC mode, happily supplying a regulated charge current into the battery. However, for scenario 2 the battery’s voltage is greater than the power supply’s CV setting (for example, you have your automobile battery charger set to 6 volts when you connect it to a 12 volt battery). Providing the power supply is not able to sink current the battery forces the power supply’s output voltage up along the graph’s voltage axis to the battery’s voltage level. Operating along this whole range of voltage greater than the power supply’s output voltage setting puts the power supply into its UNR mode of operation.
Figure 2: Single quadrant power supply IV characteristic with a battery load

A danger here is more sophisticated power supplies usually incorporate Over Voltage Protection (OVP). One kind of OVP is a crowbar which is an SCR designed to short the output to quickly bring down the output voltage to protect the (possibly expensive) device being powered. When connected to a battery if an OVP crowbar is tripped, damage to the power supply or battery could occur due to batteries being able to deliver a fairly unlimited level of current. It is worth knowing what kind of OVP there is in a power supply before attempting to charge a battery with it. Better yet is to use a power supply or charger specifically designed to properly monitor and charge a given type of battery. The designers take these things into consideration so you don’t have to!
I have digressed here a little on yet another mode, OVP, but it’s all worth knowing when working with power supplies! Can you think of other scenarios that might drive a power supply into UNR? (Hint: How about the other end of the power supply IV characteristic, where it meets the horizontal current axis?)