Showing posts with label battery drain analysis. Show all posts

Wednesday, July 29, 2015

Battery drain test on anniversary gift clock

Last month, on June 2, 2015, I celebrated working for Hewlett-Packard/Agilent Technologies/Keysight Technologies for 35 years. During the earlier times of my career, on significant anniversaries such as 10 years or 20 years, employees could choose from a catalog of gifts to have their contributions to the company recognized. That tradition has been discontinued, but I did select a couple of nice gifts over the years. During my HP days, one gift I selected was a clock with a stand shown here:
I have had that clock for decades and it uses a silver oxide button cell battery (number 371). I have to replace the battery about once per year and wondered if that made sense based on the battery capacity and the current drain the clock presents to the battery. I expected the battery to last longer so I wanted to know if I was purchasing inferior batteries. These 1.5 V batteries are rated for about 34 mA-hours. So I set out to measure the current drain using our N6705B DC Power Analyzer with an N6781A 2-Quadrant Source/Measure Unit for Battery Drain Analysis power module installed. Making the measurement was simple…..making the connections to the tiny, delicate battery connection points was the challenging part. After one or two failed attempts (I was being very careful because I did not want to damage the connections), I solicited the help of my colleague, Paul, who handily came up with a solution (thanks, Paul!). Here is the final setup and a close-up of the connections:


I set the N6781A voltage to 1.5 V and used the N6705B built-in data logger to capture current drawn by the clock for 5 minutes, sampling voltage and current about every 40 us. The clock has a second hand and as expected, the current showed pulses once per second when the second hand moved (see Figure 1). Each current pulse looks like the one shown in Figure 2. There was an underlying 200 nA being drawn in between second-hand movements. All of this data is captured and shown below in Figure 3 showing the full 5 minute datalog along with the amp-hour measurement (0.28 uA-hours) and average current measurement (3.430 uA) between the markers.


Given the average current draw, I can calculate how long I would expect a 34 mA-hour battery to last:

                 34 mAh / 3.430 uA average current = 9912.54 hours = about 1.13 years

This is consistent with me changing the battery about every year, so once again, all makes sense in the world of energy and electronics (whew)! Thanks to the capabilities of the N6705B DC Power Analyzer, I now know the batteries I’m purchasing are lasting the expected time given the current drawn by the clock. How much current is your product drawing from its battery?

Tuesday, June 16, 2015

When is it best to use a battery or a power supply for testing my battery powered device?

As I do quite a bit of work with mobile battery powered devices I regularly post articles here on our “Watt’s Up?” blog about aspects on testing and optimizing battery life for these devices. As a matter of fact my posting from two weeks ago is about the webcast I will be doing this Thursday, June 18th: “Optimizing Battery Run and Charge Times of Today’s Mobile Wireless Devices”. That’s just two days away now!

With battery powered devices there are times it makes sense to use the device’s actual battery when performing testing and evaluation work to validate and gain insights on optimizing performance. In particular you will use the battery when performing a battery run-down test, to validate run-time. Providing you have a suitable test setup you can learn quite a few useful things beyond run-time that will give insights on how to better optimize your device’s performance and run-time. I go into a number of details about this in a previous posting of mine: “Zero-burden ammeter improves battery run-down and charge management testing of battery-powered devices”. If you are performing this kind of work you should find this posting useful.

However, there are other times when it makes sense to use a power supply in place of the device’s battery, to power up the device for the purpose of performing additional types of testing and evaluation work for optimizing the device’s performance. One major factor for this is the power supply can be directly set to specific levels which remain fixed for the desired duration. It eliminates the variability and difficulties of trying to do likewise with a battery, if at all possible. In most all instances it is important that the power supply provides the correct characteristics to properly emulate the battery. This includes:
  • Full two-quadrant operation for sourcing and sinking current and power
  • Programmable series resistance to simulate the battery’s ESR

These characteristics are depicted in the V-I graph in figure 1.


Figure 1: Battery emulator power supply output characteristics

Note that quadrant 1 operation is emulating when the battery is providing power to the device while quadrant 2 is emulating when the battery is being charge by the device.


A colleague here very recently had an article published that goes into a number of excellent reasons why and when it is advantageous to use a power supply in place of trying to use the actual battery, “Simulating a Battery with a Power Supply Reaps Benefits”. I believe you will find this to also be a useful reference.

Wednesday, June 3, 2015

Webcast this June 18th: Optimizing Battery Run and Charge Times of Today’s Mobile Wireless Devices

One thing for certain: Technological progress does not stand still for a moment and there is no place where this is any truer than for mobile wireless devices! Smart phones, tablets, and phablets have all but totally replaced yesterday’s mobile phones and other personal portable devices. They provide virtually unlimited information, connectivity, assistance, and all kinds of other capabilities anywhere and at any time.

However, as a consequence of all these greater capabilities and time spent being actively used is battery run time limitations. Battery run time is one of top dissatifiers of mobile device users. To help offset this manufacturers are incorporating considerably larger capacity batteries to get users through their day. I touched upon this several weeks ago with my earlier posting “Two New Keysight Source Measure Units (SMUs) for Battery Powered Device and Functional Test”. We developed higher power versions of our N678xA series SMUs in support of testing and development of these higher power mobile devices.

Ironically, a consequence of higher capacity batteries leads to worsening of another top user dissatifier, and that is battery charging time. Again, technological progress does not stand still! New specifications define higher power delivery over USB, which can be used to charge these mobile devices in less time. I also touched upon this just a few weeks ago with my posting “Updates to USB provide higher power and faster charging”. The power available over USB will no longer be the limiting factor on how long it takes to recharge a mobile device.

I have been doing a good amount of investigative work on these fronts which has lead me to put together a webcast “Optimizing Battery Run and Charge Times of Today’s Mobile Wireless Devices”. Here I will go into details about operation of these mobile devices during use and charging, and subsequent testing to validate and optimize their performance.  If you do development work on mobile devices, or even have a high level of curiosity, you may want to attend my webinar on June 18. Additional details about the webcast and registration are available at: “Click here for accessing webcast registration”. I hope you can make it!


Tuesday, February 24, 2015

Two New Keysight Source Measure Units (SMUs) for Battery Powered Device and Functional Test

Over the past few years here on “Watt’s Up?” I have posted several articles and application pieces on performing battery drain analysis for optimizing run time on mobile wireless devices. The key product we provide for this application space is the N6781A 20V, +/-3A, 20W source measure module for battery drain analysis. A second related product we offer is the N6782A 20V, +/-3A, 20W source measure module for functional test. The N6782A has a few less key features used for battery drain analysis but is otherwise the same as the N6781A. As a result the N6782A is preferred product for testing many of the components used in mobile devices, where the extra battery drain analysis features are not needed. These products are pictured in Figure 1. While at first glance they may appear the same, one thing to note is the N6781A has an extra connector which is independent voltmeter input. This is used for performing a battery run-down test, one of a number of aspects of performing battery drain analysis. Details on these two SMUs can be found on by clicking on: N6781A product page.  N6782A product page,


Figure 1: Keysight N6781A SMU for battery drain analysis and N6782A for functional test

These products have greatly helped customers through their combination of very high performance specialized sourcing and measurement capabilities tailored for addressing the unique test challenges posed by mobile wireless devices and their components. However, things have continued to evolve (don’t they always!). Today’s mobile devices, like smart phones, tablets and phablets, have an amazing amount of capabilities to address all kinds of applications. However, their power consumption has grown considerably as a result. They are now utilizing much larger batteries to support this greater power consumption in order to maintain reasonably acceptable battery run-time. Optimizing battery life continues to be a critical need when developing these products. With their higher power however, there is in turn a greater need for higher power SMUs to power them during test and development. In response we have just added two new higher power SMUs to this family; the N6785A 20V, +/-8A, 80W source measure module for battery drain analysis and the N6785A 20V, +/-8A, 80W source measure module for functional test. These products are pictured in Figure 2. Details on these two new higher power SMUs can be found on by clicking on: N6785A product page.  N6786A product page.


Figure 2: Keysight N6785A SMU for battery drain analysis and N6786A for functional test

A press release went out about these two new SMUs yesterday; Click here to view. With their greater current and power capability, customers developing and producing these advanced mobile wireless devices and their components now have a way to test them to their fullest, not being encumbered by power limitations of lower power SMUs.

This is exciting to me having been working within the industry for quite some time now, helping customers increase battery life by improving how their devices make more efficient use of the battery’s energy. A key part of this has been by using our existing solutions for battery drain analysis to provide critical insights on how their devices are making use of the battery’s energy.  There is a lot of innovation in the industry to make mobile wireless devices operate with even greater efficiency at these higher power and current levels. There is no other choice if they are going to be successful. Likewise, it is great to see continuing to play a key role in this trend in making it a success!

.

Thursday, August 15, 2013

Techniques for using the Agilent N6781A and N6782A and their seamless measurement ranging when currents exceed 3 amps

In an earlier posting “Zero-burden ammeter improves battery run-down and charge management testing of battery-powered devices” (click here to access) I had talked about how the Agilent N6781A 2-quadrant SMU can alternately be used as a zero-burden ammeter. When placed in the current path as a zero-burden ammeter, due to its extended seamless measurement ranging, it can measure currents from nanoamps, up to +/-3 amps, which is the maximum limit of the N6781A. The N6782A 2-quadrant SMU can also be used as a zero burden ammeter. It is basically the same as the N6781A but with a few less features.

One customer liked everything about the N6782A’s capabilities, but he had a battery-powered device that drew well over 3 amps when it was active. When in standby operation its current drain ranged back and forth between just microamps of sleep current to 6 or greater amps of current during periodic wake ups. The N6782A’s +/- 3 amps of current was not sufficient to meet their needs.

An alternate approach was taken that worked out well for this customer, which was made possible only because of the N6782A’s zero-burden ammeter capability. The set up is shown in Figure 1.


Figure 1: Setup for measuring micro-amps in combination with large active-state currents

The N6752A 50V, 10A, 100W autoranging DC power module provides all the power. The N6782A is set up as a zero-burden ammeter and is connected in series with the N6752A’s output. When current ranges from microamps up to +/- 3 amps the N6782A maintains its zero-burden ammeter operation, holding its output voltage at zero. Once +/- 3 amps is exceeded, the N6782A goes into current limit and the voltage increases across its output, at which point one of the back-to-back clamp diodes turns on, conducting current in excess of 3 amps through it. This all can be observed in the screen image of the 14585A software in Figure 2. The blue trace is the N752A’s output current. The middle yellow trace is the N6781A’s current and the top yellow trace is the N6781A’s voltage.


Figure 2: Current and voltage signals for Figure 1 setup captured with 14585A software

In Figure 2 measurement markers have been placed across a portion of the sleep current and we find from the N6782A’s measurement readback it is just 1.458 microamps average. The reason why this works is because of zero burden operation. Because the N6782A is maintaining zero volts across its output, there is no current flowing through either diode. If this same thing was attempted using a conventional ammeter or current shunt, the voltage would increase and current would flow through a diode, corrupting the measurement.

Now the customer was able to get the microamp sleep current readings from the N6782A and at the same time get the high level wake up current readings from the N6752A!

In a similar fashion another customer wanted to perform battery run down testing. Everything was excellent about using the N6781A in its zero-burden ammeter mode, along with using its independent DVM input for simultaneously logging the battery’s run down voltage in conjunction with the current. The only problem was they wanted to test a higher power device. At device turn-on, it would draw in excess of 3 amps, which is the current limit of the N6781A. Current limit would cause the N6781A to drop out of its zero-burden ammeter operation and in turn the device would shut back down due to low voltage. The solution was simple; add the back-to-back diodes across the N6781A acting as a zero-burden ammeter, as shown in Figure 3.  Any currents in excess of 3 amps would then pass through a diode. Schottky diodes were used so the device would momentarily see just a few tenths of a volt drop in the battery voltage, during the short peak current in excess of 3 amps. Now the customer was able to perform battery run-down testing using the N6781A along with the 14585A software to log all the results!


Figure 3: Agilent N6781A battery run-down test set up, with diode clamps for peak currents above 3A


Thursday, August 8, 2013

Zero-burden ammeter improves battery run-down and charge management testing of battery-powered devices

One way of assessing run-time of battery-powered devices is to power them up with a regulated DC source, place the device into its appropriate operating modes, and get the corresponding current drawn by the device for each of the various operating modes. Estimations of battery run-time can then be made for different user types, based on the percentage of time spent in each of these operating modes, and the capacity of the battery in mA-hours. The DC source must be able to maintain a stable, transient free voltage at the DUT. A lot of general purpose power supplies have difficulty with mobile wireless devices that draw fast rising, high peak currents. Providing the regulated DC source meets maintains a stable voltage, it offers some advantages, including:
  • Maintains a fixed voltage level over time, removing variability due to changing voltage.
  • Using built-in current read-back eliminates voltage drop issues encountered with using a resistive shunt. This is problematic with mobile wireless devices that draw high peak, but low average current.


An alternative to using a regulated DC source to power the battery powered device is instead use the actual battery. Just like with using a DC source, one can make representative current drain measurements over shorter periods for all the various operating modes and then make predictions on run-time. Alternately one can also perform actual battery run-down tests which, when performed correctly, yields quite a few more insights beyond representative current drain measurements, such as:
  • Low battery discharge termination details.
  • Battery capacity and energy actually delivered.
  • Actual run time achieved.
  • How well the battery and device work together as a system


An actual battery-run down test is an indispensable part of validation as a final proof of performance.

Just as with evaluating battery run-down, it is also just as important to evaluate battery charging and management. Again, a lot of testing can be done on a device independent of its battery, but there is also a lot of additional value in validating a device’s charge management performance with its actual battery.

When validating a device’s discharging and charging performance with an actual battery, the first test challenge is the current drawn from or sourced to the battery needs to be accurately measured and logged over time, together with the battery’s voltage, for making good capacity and energy measurements. The second test challenge here is you cannot afford to introduce any significant drop in voltage between the device and its battery, as this alters charging and discharging performance of the battery powered device. This can be a real problem when trying to use shunt resistors.

An alternative is to use a zero-burden ammeter. You may ask how an ammeter can be zero-burden. It has to have some resistance in order to produce a measurable value, right? Well, not always. Agilent provides an innovative alternative use of the N6781A 2-quadrant source measure module that enables it to operate as a zero-burden ammeter (in addition to being a DC source). Using the N6781A as a zero-burden ammeter to evaluate battery run-down and battery charging of a battery-powered device is depicted in Figure 1.


Figure 1: N6781A zero-burden ammeter / wattmeter operation

The N6781A is able to operate as a zero-burden ammeter because it is able to actively regulate its output at zero volts independent of the current flowing through it. Because its output is zero volts, when placed in series between the device and its battery, there is no voltage drop. At the same time its precision current measurement system is able to now measure the discharge or charge currents. In addition a separate voltage measurement port allows it to measure the battery voltage, so now you are able to capture the battery’s discharge or charge voltage profile, as well as determine charge in amp-hours and energy in watt-hours, as shown in Figure 2.


Figure 2: Capturing, displaying, and evaluating battery run-down results with 14585A software

A useful reference providing further details on evaluating a device’s battery run-down and charging, and how to configure and use the N6781A as a zero-burden ammeter are available in our application note; “Evaluating Battery Run-Down with the N6781A 2-Quadrant Source Measure Unit and the 14585A Control and Analysis Software” (click here to access).

Tuesday, July 30, 2013

Power analysis of automobile self-charging emergency tool

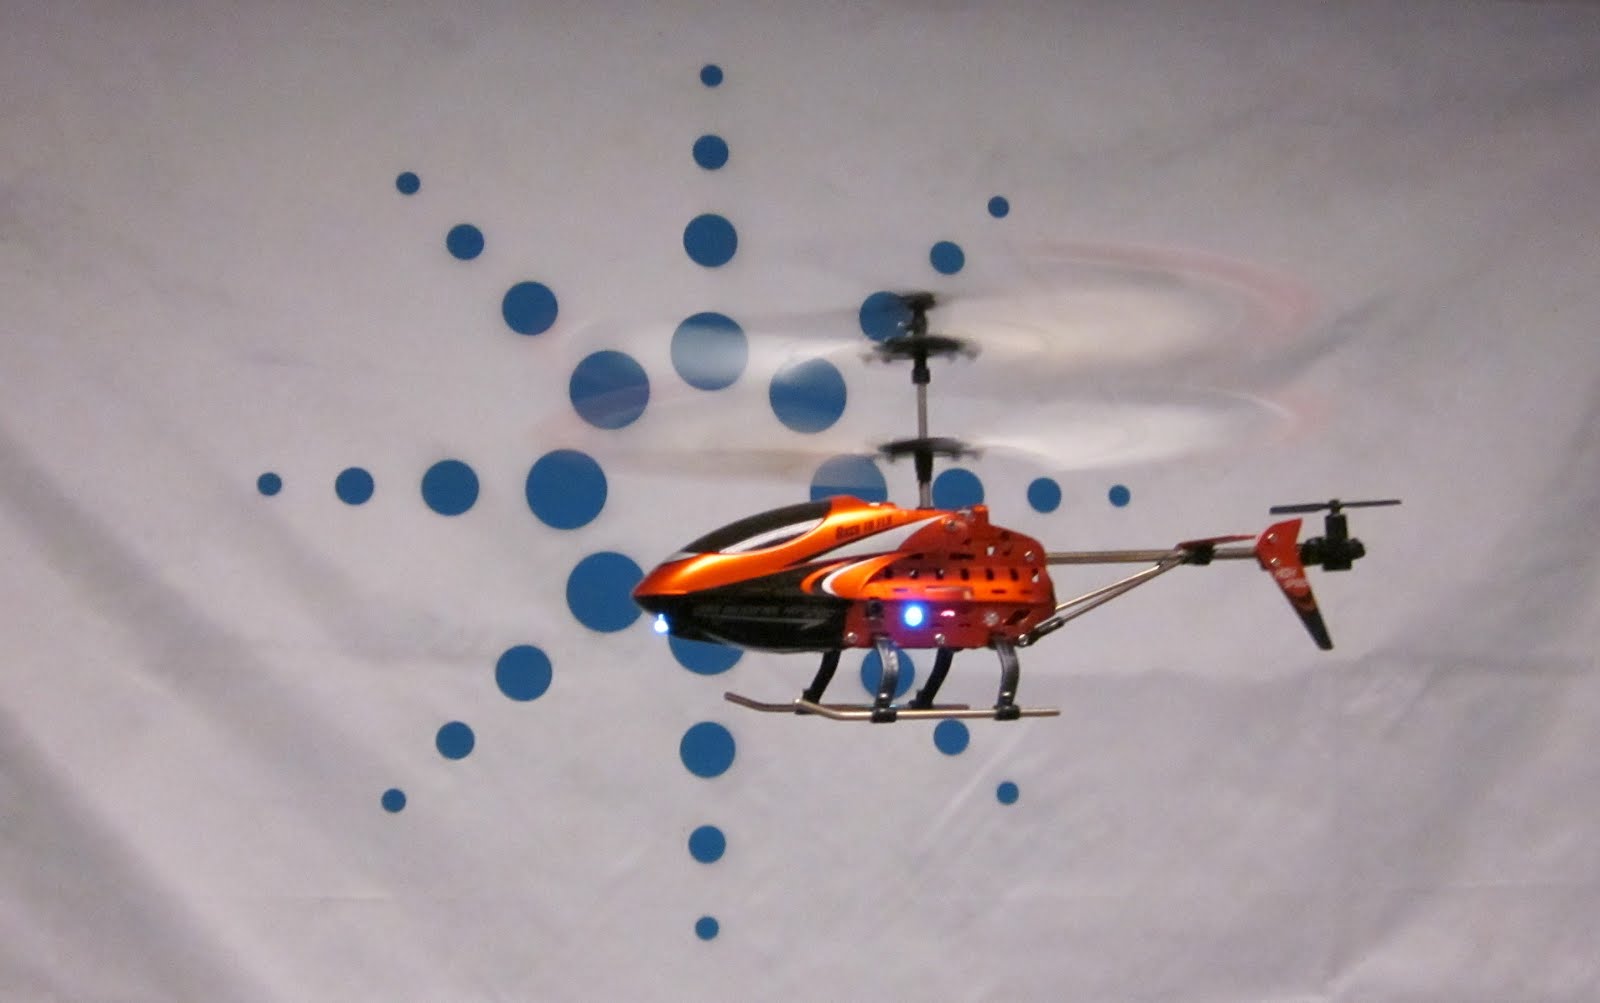
I was recently given a “Swiss+Tech BodyGard Survivor 8-in-1 Automobile Self-Charging Emergency Tool”. How’s that for a compact name? This device does have many features, so I imagine the company had some difficulty devising a name for it. It is meant to be carried in your car and kept close enough to the driver to be used in an emergency. It contains a glass breaker, a seatbelt cutter, a flashlight, an emergency flasher and siren, an AM/FM radio, and rechargeable NiCad batteries that charge by using the self-charging hand crank. See Figure 1.
Since this device contains rechargeable batteries and Agilent makes instrumentation that can do battery drain analysis, I figured I would test the device using our equipment. I used an Agilent N6705B DC Power Analyzer loaded with an N6781A 2-Quadrant Source/Measure Unit (SMU) for Battery Drain Analysis. See Figure 2.

The product’s instruction sheet includes information about the batteries (700 mAH) and the expected battery run time when using the various features. With fully charged batteries, the expected battery run time for each of the features listed below is:

  • Flashlight: 12 to 16 hours
  • Flasher: 10 to 12 hours
  • Radio (low volume): 35 to 40 hours
  • Flasher/siren: 6 to 9 hours

Given the battery amp-hour rating (700 mAH) and the expected run time in hours, we can calculate the approximate expected average current draw for each of the various features:

  • Flashlight: 700 mAH / 14 hours = 50 mA
  • Flasher: 700 mAH / 11 hours = 63.6 mA
  • Radio: 700 mAH / 37.5 hours = 18.7 mA
  • Flasher/siren: 700 mAH / 7.5 hours = 93 mA

Using the N6781A SMU and the built-in front panel features of the N6705B DC Power Analyzer, I was able to analyzer the current drawn from the batteries when using each of the features. Each feature was used by itself with the other features turned off.

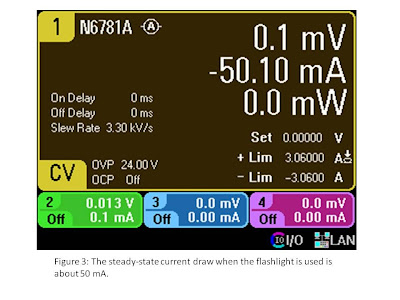
The flashlight draws a steady-state current that I read right from the front panel meter as shown in Figure 3: 50 mA. This agrees perfectly with the expected current draw I calculated. For this measurement and all subsequent current measurements, I connected the N6781A in series with the batteries and set it to Current Measure mode where it acts likes a zero-burden shunt. The measured current is negative in my setup because positive current is current flowing into the battery and with the flashlight on, current is flowing out of the battery.
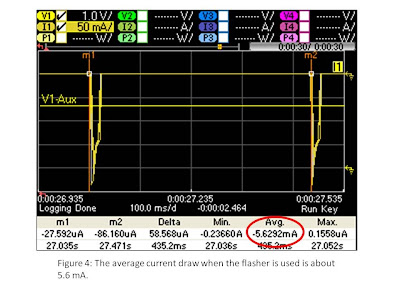
For the flasher, since the current is not constant, I used the N6705B/N6781A built-in data logger feature and captured 30 seconds of data while the device was flashing. I then used the markers to measure the average current. Since the flasher flashes for a very short period of time (low duty cycle), I expected the average current to be low. When using the flasher, the expected battery run time seemed unusually short to me. At 10 to 12 hours, it is shorter than the flashlight or radio run time, which seems odd. In reality, as shown in Figure 4, the flasher drew very little current (5.6 mA), so it appears that the instruction sheet run time for the flasher is too low. With the device flashing, the battery will last much longer than indicated. In fact, the expected battery run time, when flashing, is about 700 mAH / 5.6 mA = 125 hours, 10 times longer than the time shown on the instruction sheet!

With the radio on, tuned to a station, and set to a low but audible volume, I once again used the data logger to capture the current. The markers show an average current of about 10 mA, which is less than the calculated value of 18.7 mA, but within reason. See Figure 5.

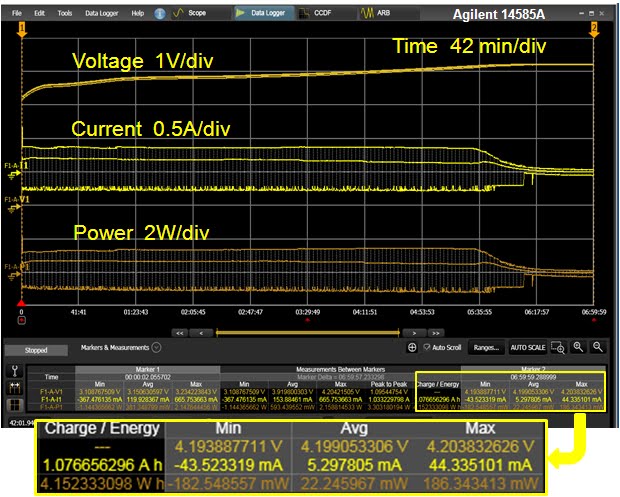
Using the flasher and siren, the data logger shows a current draw of 93 mA, in exact agreement with the expected current draw calculated from the numbers on the instruction sheet. See Figure 6.

The last current analysis I did was to capture 30 seconds of data logging when turning the self-charging crank to recharge the batteries. I purposely varied my cranking rate to see what would happen. Figure 7 shows an average of about 350 mA when turning the crank at what I considered to be a typical rate (highest average numbers on the captured data log). To fully charge 700 mAH batteries, it would take about 2 hours at that rate, which is in agreement with the instruction sheet (it says 2 to 3 hours). I don’t know about you, but I don’t want to turn that crank for 2 hours straight! Let’s hope I never have to use the tool for real, but I’m glad I have it just in case!


Wednesday, September 26, 2012

Battery-killing cell phone apps? – Part 2

Back on May 25, 2012, I posted about mobile device users avoiding security apps because they think the apps run down their batteries too quickly (read that post here). I also mentioned that a member of the Anti-Malware Testing Standards Organization (AMTSO) is using Agilent’s N6705B DC Power Analyzer to evaluate just how much the security apps affect battery run time and that the results would not be available for a few months. Well, the results are in and guess what? Which security app you choose does not make much difference in your battery run time.

On average, they reported that the effect of using a security app on reducing battery run time is only about 2% which translates into less than 30 minutes of lost battery life per day. And the study went on to explain that the differences in performance of one mobile security product to another were small (they tested 13 products each from a different vendor). I was amused by the author’s comment that they were “not providing a ranking” because it “could get misused by marketing departments”. Indeed!

Here is a link to the report:
http://www.av-comparatives.org/images/docs/avc_mob_201209_en.pdf

The report shows a picture of Agilent’s N6705B DC Power Analyzer as the measuring device. They used this product because “This high-precision instrument can measure battery drain exactly”. A screen shot of Agilent’s 14585A Control and Analysis Software for the DC Power Analyzer was also shown in the report. The software allowed them to evaluate power consumption while performing various mobile phone tasks, such as making phone calls, viewing pictures, browsing websites, watching YouTube (I wonder if they watched any of the DC Power Analyzer videos we have posted!), watching locally stored videos, receiving and sending mails, and opening documents.

If the N6705B DC Power Analyzer and 14585A Control and Analysis Software can evaluate power consumption for all of those things, just think of what it could do for you! Check out Ed’s post from earlier this week for some of those things: http://powersupplyblog.tm.agilent.com/2012/09/optimizing-mobile-device-battery-run.html

Monday, September 24, 2012

Optimizing Mobile Device Battery Run-time Seminars


On many occasions in the past here both I, and my colleague, Gary, have written about measuring, evaluating, and optimizing battery life of mobile wireless battery powered devices. There is no question that, as all kinds of new and innovative capabilities and devices are introduced; battery life continues to become an even greater challenge.

I recently gave a two-part webcast entitled “Optimize Wireless Device Battery Run-time”. In the first part “Innovative Measurements for Greater Insights” a variety of measurement techniques are employed on a number of different wireless devices to illustrate the nature of how these devices operate and draw power from their batteries over time, and in turn how to go about making and analyzing the measurements to improve the device’s battery run-time. Some key points brought out in this first part include:
  • Mobile devices operate in short bursts of activities to conserve power. The resulting current drain is pulsed, spanning a wide dynamic range. This can be challenging for a lot of traditional equipment to accurately measure.
  • Not only is a high level of dynamic range of measurement needed for amplitude, but it is also needed on the time axis as well, for gaining deeper insights on optimizing a device’s battery run-time.
  • Over long periods of time a wireless device’s activity tends to be random in nature. Displaying and analyzing long term current drain in distribution plots can quickly and concisely display and quantify currents relating to specific activities and sub-circuits that would otherwise be difficult to directly observe in a data log.
  • The battery’s characteristics influence the current and power drawn by the device. When powering the device by other than its battery, it can be a significant source of error in testing if it does not provide results like that of when using the battery.


Going beyond evaluating and optimizing the way the device makes efficient use of its battery power, the second part, “The Battery, its End Use, and Its Management” brings out the importance of, and how to go about making certain you are getting the most of the limited amount of battery power you have available to you. Some key points for this second part include:
  • Validating the battery’s stated capacity is a crucial first step both for being certain you are getting what is expected from the battery and serve as a starting reference point that you can correlate back to the manufacturer’s data.
  • Evaluating the battery under actual end-use conditions is important as the dynamic loading a wireless device places on the battery often adversely affects the capacity obtained from the battery.
  • Charging, for rechargeable batteries, must be carefully performed under stated conditions in order to be certain of in turn getting the correct amount of capacity back out of the battery. Even very small differences in charging conditions can lead to significant differences in charge delivered during the discharge of the battery.
  • The wireless device’s battery management system (or BMS) needs to be validated for proper charging of the battery as well as suitability for addressing the particular performance needs of the device.


In Figure 1 the actual charging regiment was captured on a mobile phone battery being charged by its BMS. There turned out to be a number of notable differences in comparison to when the battery was charged using a standard charging regiment.


Figure 1: Validating BMS charge regiment on a GSM/GPRS mobile phone

If you are interested in learning more about optimizing wireless device battery run-time this two part seminar is now available on-demand at:


I think you will enjoy them!

Wednesday, June 20, 2012

Battery drain analysis of handheld HP 973A multimeter

I have owned a Hewlett-Packard 973A multimeter for longer than I can remember. What has always amazed me about this meter is that I have never had to change the batteries in it! It runs off of 2 AA batteries (in series, of course), and earlier this week, I had to open it up to change a blown fuse for the mA/uA current measurement input (that’s what I get for lending the meter to someone).


While I had it open, I took a look at the AA batteries and was surprised to see a date code of 04-99. That means these batteries have been powering this multimeter for at least 13 years! I admit that I don’t use the meter very frequently, but I am still impressed with how long these batteries lasted. The series combination measured about 2.6 V – still plenty of charge left to power the multimeter (2 new batteries in series measure about 3.2 V).


Since we make power supplies that can perform battery drain analysis, I decided to take a quick look at the current drawn by the multimeter from these batteries. I used an Agilent N6705B mainframe with an N6781A Source/Measure Unit (SMU) installed. This SMU has many features that make it easy to analyze current drain. For example, I set the SMU for Current Measure mode which means it acts like a zero-burden ammeter (an ammeter with no voltage drop across the inputs). I found that the multimeter (set to measure DC V) draws about 3.5 mA from the 2.6 V series combination of AA batteries. I used both the Meter View feature of the SMU and the Data Logger to verify the current. The Data Logger shows the dynamic current being drawn from the batteries and I measured the average current between the markers.


Typical AA batteries are rated for about 2500 mA-hours, so with a 3.5 mA load, they will last more than 700 hours. It is no wonder that the batteries lasted a long time; I use this meter only a few hours per month, so assuming 3 hours per month, the batteries would last about 20 years!

While I had the back cover off, I removed the batteries and powered the multimeter directly from the N6781A SMU. I could then slowly lower the voltage and find when the low battery indicator came on. This happened at about 2.3 V. Continuing to lower the voltage, the LCD display continued to work down to almost 1.0 V. I also noticed that the current drawn by the multimeter increased as the voltage decreased – the multimeter was drawing a nearly constant amount of power from the source – roughly 9 to 10 mW.


I figured while I had the multimeter open, I might as well install new batteries. I doubt I will write another post the next time these batteries need to be replaced in 20 to 30 years, but keep checking here.… you never know!

Friday, May 25, 2012

Battery-killing cell phone apps?

Two days ago, I came across an article entitled “Do Android Security Apps Kill Your Batteries?” The article talks about mobile device users avoiding security apps because they think the apps run down their batteries too quickly. A member of the Anti-Malware Testing Standards Organization (AMTSO) is using Agilent’s N6705B DC Power Analyzer to evaluate just how much the security apps affect battery run time. While the results are not yet complete, the researchers are planning to measure power usage with no security app running, with the app running in the background, and with the app actively working. Their full report is due out by the end of July. Here is a link to the article, written by Neil Rubenking in his SecurityWatch blog for PC Magazine Digital Edition:

http://securitywatch.pcmag.com/mobile-security/298170-do-android-security-apps-kill-your-batteries

I was pleased to see the N6705B DC Power Analyzer used in this way – this product has power modules and software that are specifically designed to do exactly this type of evaluation!


If you have to evaluate a mobile device’s battery run time for any reason, here is a link to “10 Tips to Optimize a Mobile Device’s Battery Life” written by our own Ed Brorein (contributor extraordinaire to this blog):

http://cp.literature.agilent.com/litweb/pdf/5991-0160EN.pdf


And here is a link to Ed’s post from a few months ago on “Using Current Drain Measurements to Optimize Battery Run-time of Mobile Devices”:

http://powersupplyblog.tm.agilent.com/2012/03/using-current-drain-measurements-to.html

When the researchers complete and publish their evaluation on how security apps affect your cell phone battery run time, we’ll be sure to follow-up with another post! In the mean time, protect your phone in whatever way you like, and keep charging ahead by charging your batteries!

Wednesday, March 21, 2012

Using Current Drain Measurements to Optimize Battery Run-time of Mobile Devices

One power-related application area I do a great deal of work on is current drain measurements and analysis for optimizing the battery run-time of mobile devices. In the past the most of the focus has been primarily mobile phones. Currently 3G, 4G and many other wireless technologies like ZigBee continue to make major inroads, spurring a plethora of new smart phones, wireless appliances, and all kinds of ubiquitous wireless sensors and devices. Regardless of whether the device is overly power-hungry due to running data-intensive applications or power-constrained due to its ubiquitous nature, there is a need to optimize its thirst for power in order to get the most run-time from its battery. The right kind of measurements and analysis on the device’s current drain can yield a lot of insight on the device’s operation and efficiency of its activities that are useful for the designer in optimizing its battery run-time. I recently completed an article that appeared in Test & Measurement World, on-line back in November and then in print in their Dec 2011- Jan 2012 issue. Here is a link to the article:
http://www.tmworld.com/article/520045-Measurements_optimize_battery_run_time.php

A key factor in getting current drain measurements to yield the deeper insights that really help optimize battery run-time is the dynamic range of measurement, both in amplitude and in time, and then having the ability to analyze the details of these measurements. The need for a great dynamic range of measurement stems from the power-savings nature of today’s wireless battery powered devices. For power-savings it is much more efficient for the device to operate in short bursts of activities, getting as much done as possible in the shortest period of time, and then go into a low power idle or sleep state for an extended period of time between these bursts of activities. Of course the challenge for the designer to get his device to quickly wake up, stabilize, do its thing, and then just as quickly go back to sleep again is no small feat! As one example the current drain of a wireless temperature transmitter for its power-savings type of operation is shown in Figure 1.


Figure 1: Wireless temperature transmitter power-savings current drain

The resulting current drain is pulsed. The amplitude scale has been increased to 20 µA/div to show details of the signal’s base. This particular device’s current drain has the following characteristics:
• Period of ~4 seconds
• Duty cycle of 0.17%
• Currents of 21.8 mA peak and 53.7 µA average for a crest factor of ~400
• Sleep current of 7 µA
This extremely wide dynamic range of amplitude is challenging to measure as it spans about 3 ½ decades. Both DC offset error and noise floors of the measurement equipment must be extremely low as to not limit needed accuracy and obscure details.

Likewise being able to examine details of the current drain during the bursts of activities provides insights about the duration and current drain level of specific operations within the burst. From this you can make determinations about efficiencies of the operations and if there is opportunity to further optimize them. As an example, in standby operation a mobile phone receives in short bursts about every 0.25 to 1 seconds to check for incoming pages and drops back into a sleep state in between the receive (RX) bursts. An expanded view of one of the RX current drain bursts is shown in figure 2.


Figure 2: GPRS mobile phone RX burst details

There are a number of activities taking place during the RX burst. Having sufficient measurement bandwidth and sampling time resolution down to 10’s of µsec provides the deeper insight needed for optimizing these activities. The basic time period for the mobile phone standby operation is on the order of a second but it is usually important to look at the current drain signal over an extended period of time due to variance of activities that can occur during each of the RX bursts. Having either a very deep memory, or even better, high speed data logging, provides the dynamic range in time to get 10’s of µsec of resolution over an extended period of time, so that you can determine overall average current drain while also being able to “count the coulombs” it takes for individual, minute operations, and optimize their efficiencies.

Anticipate seeing more here in future posts about mobile wireless battery-powered devices, as it relates to the “DC” end of the spectrum. In the meantime, while you are using your smart phone or tablet and battery life isn’t quite meeting your expectation (or maybe it is!), you should also marvel at how capable and compact your device is and how far it has come along in contrast to what was the state-of-the-art 5 and 10 years ago!

Friday, February 17, 2012

The economics of recharging your toy helicopter

While on a business trip visiting customers in Taiwan back in December, I got a toy helicopter as a thank-you gift from one of my coworkers (thanks, Sharon!). This toy helicopter is fun to fly and is surprisingly stable in the air.


Flight time is about 7 minutes, and the battery recharge time is about 40 minutes. It can be recharged from a powered USB port by using a wire that came with the toy that has a USB connector on one end and the helicopter charging connector on the other end. Or, it can be recharged from the six AA alkaline batteries inside the handheld controller via a wire that exits from the controller. Thinking I did not want to prematurely drain the controller batteries, I typically used the USB charging method by using my iPad’s 10 W USB power adapter plugged into a wall outlet. So I got to thinking about which charging method was more economical: charging from a wall outlet or from the batteries. Luckily, I have test equipment at my disposal that can help me answer that question!


Recharging using AC power via USB power adapter
Using one of our Agilent 6812B AC sources, I captured the AC power used during a recharge cycle. I used the AC source GUI to take readings of power every second for the charge period and plotted it in a spreadsheet (graph shown below). I found that the power consumed started at about 2.2 W and ended at about 1.2 W roughly 41 minutes later. The energy used during this time was 1.1 W-hours. Where I live in New Jersey, the utility company charges about 15 cents per kilowatt-hour, so 1.1 W-hours of energy used to charge the helicopter costs fractions of a penny (0.0165 cents = US$ 0.000165). This is basically nothing!


Recharging using controller battery power
To analyze the current drawn from the controller batteries, I used one of our Agilent N6705B DC power analyzers with an N6781A SMU module installed. I ran the battery current path through the SMU set for Current Measure mode and used our 14585A Control and Analysis software. I captured the current drawn from the six AA batteries in the controller during the helicopter recharge cycle. These batteries are in series, so the same current flows through each of the six batteries and also through the SMU for my test.


For the recharge period (about 43 minutes using this method), the software shows the batteries provided 173 mA-hours of charge to the helicopter. A typical AA alkaline battery is rated for 2500 mA-hours, so that means I would get about 14 (= 2500/173) charge cycles from these six batteries. If you shop around for high-quality AA batteries, you might find them for as low as 25 cents per battery. Since the controller takes six of these, the battery cost for the controller is $1.50. If I can recharge the helicopter 14 times with $1.50 worth of batteries, each recharge cycle costs about 10.7 cents (= US$ 0.107). This is 650 times more expensive than using the AC power method, so I will continue using the wall outlet to recharge my toy helicopter! How about you?
Note that with the AC power recharge method, you pay for the kilowatt-hours you consume from your utility company. With the controller battery power method, you pay for the mA-hours you consume from your batteries. Consider this: if you choose the AC power method, you will save US$ 0.106835 per recharge cycle. That means after just 2.81 million recharge cycles, you will have saved enough money to buy yourself a real helicopter worth US$ 300,000, so you better get started now!