Showing posts with label watt-hours. Show all posts

Wednesday, January 29, 2014

Using a DC Power Supply to Regulate Energy

In a previous 2-part posting I talked about what power and energy is (part 1 – energy) (part 2 – power).  It is pretty straight-forward thing to do to use a DC power supply for regulating voltage or current. Constant voltage (CV) and constant current (CC) regulation are standard features of most all DC power supplies used in testing. However, what if you have an unusual application calling for applying a fixed amount of energy to your device under test (DUT)? For example, adding a fixed amount of energy to a calorimeter or chemical process, or testing the must (or must not) tripping energy of a fuse, or circuit breaker, or squib or detonator perhaps?

When the resistance of a device remains constant, it is relatively straight-forward to apply a fixed amount of energy to a DUT. By applying a fixed voltage or current, the power in the DUT remains constant. Then the energy is simply:

E = (V2/R)*t = (I2*R)*t

Where E is the energy in watt-seconds or joules, V is voltage in volts, R is resistance in ohms, I is the current in amps, and t is time in seconds. All you now need to do is apply the constant voltage or current for a pre-determined amount of time and you will then be delivering a fixed amount of energy to your DUT.

Many times however, a lot of DUTs do not maintain constant loading. The may have a dynamically varying loading by nature or its resistance dramatically increases as it heats up. How do you regulate a fixed amount of energy to your DUT under these circumstances? One possibility is to use one of a few specialized power supplies on the market can regulate their outputs with constant power. As the DUT’s loading decreases or increases the power supply will adjust its output accordingly in order to maintain a constant output power delivered to the DUT.  Again then, by applying this constant power for a pre-determined amount of time you will then be delivering a fixed amount of energy to your DUT.

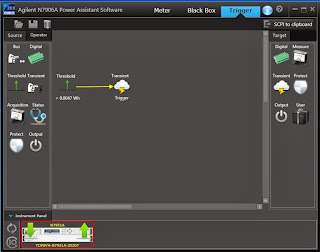
Still, for DUTs that do not maintain constant loading, it is very often not desirable, or outright unacceptable, to apply constant power sourcing.. It may be you can only apply a fixed voltage or current to your DUT. What can you do for these circumstances? Time can no longer remain a fixed value when trying to regulate a fixed amount of energy. The solution becomes quite a bit more complex, as depicted in Figure 1.


Figure 1: Regulating a fixed amount of energy to a DUT

Putting the solution depicted in Figure 1 into practice can prove challenging. The watt-hour meter needs to provide a trigger out signal when the desired watt-hour (or watt-second) threshold level is reached. This becomes even more challenging if this response time required needs to be just fractions of a second for this set up. More than likely this may become a piece of customized hardware.

Interestingly this very set up can be programmatically configured within our N6900A and N7900A series Advanced Power System (APS) power supplies. These products have Amp-hour and Watt-hour measurement integrated into their measurement systems. Not only can you measure these parameters, there is a programmable way to act on them in a variety of ways as well, which is the expression signal routing. Logical expressions can be programmed and downloaded into APS, which then acts on them at hardware-level speeds.  Creating and loading the signal routing expression into the APS unit is simplified by using the N7906A Power Assistance software, which let me do it graphically, as shown in Figure 2.


Figure 2: Graphically developing and loading an energy limit setting into an Agilent APS unit

In Figure 2 a threshold comparator was set to generate a trigger output at a level of 0.0047 watt-hours. This trigger was then routed to the output transient system, to cause the output to transition to a new output level when triggered. I had entered in zero volts as the triggered output level. Thus when the watt-hour reading reached its trigger point, the output went to zero, cutting off any more power and energy from being delivered to the DUT.

The SCPI command set for this signal routing expression is also generated from this software utility by clicking on “SCPI to clipboard”. This saves on the effort generating the code manually if you are incorporating the expression into a larger test program. For this expression the code generated is:

:SENSe:THReshold1:FUNCtion WHOur
:SENSe:THReshold1:WHOur 0.0047
:SENSe:THReshold1:OPERation GT
:SYSTem:SIGNal:DEFine EXPRession1,"Thr1"
:TRIGger:TRANsient:SOURce EXPRession1


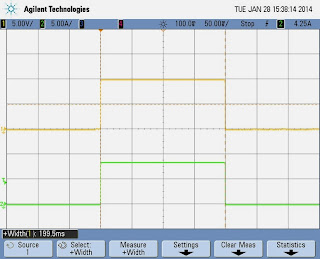
To test things out a 1.18 ohm resistive load was used to draw 84.75 watts for a 10 volt output setting. The output cut back to zero volts at nearly 200 milliseconds, as expected. This is shown in the oscilloscope capture in Figure 3.


Figure 3: APS output for an 84.75 watt load and energy limit set to 0.0047 watt-hours

The load power was then doubled by increasing the output voltage to 14.142 volts. The APS output cut back to zero volts in half the time, delivering the same amount of energy, as expected. This is depicted in the oscilloscope capture in Figure 4.


Figure 4: APS output for a 169.5 watt load and energy limit set to 0.0047 watt-hours

While using a resistor makes it easy to see that a set amount of energy is being delivered to the load. However, being able to act on a real time watt-hour energy measurement makes it very practical to do deliver a fixed amount of energy, regardless of the dynamic nature of the load over time.

Thursday, August 15, 2013

Techniques for using the Agilent N6781A and N6782A and their seamless measurement ranging when currents exceed 3 amps

In an earlier posting “Zero-burden ammeter improves battery run-down and charge management testing of battery-powered devices” (click here to access) I had talked about how the Agilent N6781A 2-quadrant SMU can alternately be used as a zero-burden ammeter. When placed in the current path as a zero-burden ammeter, due to its extended seamless measurement ranging, it can measure currents from nanoamps, up to +/-3 amps, which is the maximum limit of the N6781A. The N6782A 2-quadrant SMU can also be used as a zero burden ammeter. It is basically the same as the N6781A but with a few less features.

One customer liked everything about the N6782A’s capabilities, but he had a battery-powered device that drew well over 3 amps when it was active. When in standby operation its current drain ranged back and forth between just microamps of sleep current to 6 or greater amps of current during periodic wake ups. The N6782A’s +/- 3 amps of current was not sufficient to meet their needs.

An alternate approach was taken that worked out well for this customer, which was made possible only because of the N6782A’s zero-burden ammeter capability. The set up is shown in Figure 1.


Figure 1: Setup for measuring micro-amps in combination with large active-state currents

The N6752A 50V, 10A, 100W autoranging DC power module provides all the power. The N6782A is set up as a zero-burden ammeter and is connected in series with the N6752A’s output. When current ranges from microamps up to +/- 3 amps the N6782A maintains its zero-burden ammeter operation, holding its output voltage at zero. Once +/- 3 amps is exceeded, the N6782A goes into current limit and the voltage increases across its output, at which point one of the back-to-back clamp diodes turns on, conducting current in excess of 3 amps through it. This all can be observed in the screen image of the 14585A software in Figure 2. The blue trace is the N752A’s output current. The middle yellow trace is the N6781A’s current and the top yellow trace is the N6781A’s voltage.


Figure 2: Current and voltage signals for Figure 1 setup captured with 14585A software

In Figure 2 measurement markers have been placed across a portion of the sleep current and we find from the N6782A’s measurement readback it is just 1.458 microamps average. The reason why this works is because of zero burden operation. Because the N6782A is maintaining zero volts across its output, there is no current flowing through either diode. If this same thing was attempted using a conventional ammeter or current shunt, the voltage would increase and current would flow through a diode, corrupting the measurement.

Now the customer was able to get the microamp sleep current readings from the N6782A and at the same time get the high level wake up current readings from the N6752A!

In a similar fashion another customer wanted to perform battery run down testing. Everything was excellent about using the N6781A in its zero-burden ammeter mode, along with using its independent DVM input for simultaneously logging the battery’s run down voltage in conjunction with the current. The only problem was they wanted to test a higher power device. At device turn-on, it would draw in excess of 3 amps, which is the current limit of the N6781A. Current limit would cause the N6781A to drop out of its zero-burden ammeter operation and in turn the device would shut back down due to low voltage. The solution was simple; add the back-to-back diodes across the N6781A acting as a zero-burden ammeter, as shown in Figure 3.  Any currents in excess of 3 amps would then pass through a diode. Schottky diodes were used so the device would momentarily see just a few tenths of a volt drop in the battery voltage, during the short peak current in excess of 3 amps. Now the customer was able to perform battery run-down testing using the N6781A along with the 14585A software to log all the results!


Figure 3: Agilent N6781A battery run-down test set up, with diode clamps for peak currents above 3A


Thursday, August 8, 2013

Zero-burden ammeter improves battery run-down and charge management testing of battery-powered devices

One way of assessing run-time of battery-powered devices is to power them up with a regulated DC source, place the device into its appropriate operating modes, and get the corresponding current drawn by the device for each of the various operating modes. Estimations of battery run-time can then be made for different user types, based on the percentage of time spent in each of these operating modes, and the capacity of the battery in mA-hours. The DC source must be able to maintain a stable, transient free voltage at the DUT. A lot of general purpose power supplies have difficulty with mobile wireless devices that draw fast rising, high peak currents. Providing the regulated DC source meets maintains a stable voltage, it offers some advantages, including:
  • Maintains a fixed voltage level over time, removing variability due to changing voltage.
  • Using built-in current read-back eliminates voltage drop issues encountered with using a resistive shunt. This is problematic with mobile wireless devices that draw high peak, but low average current.


An alternative to using a regulated DC source to power the battery powered device is instead use the actual battery. Just like with using a DC source, one can make representative current drain measurements over shorter periods for all the various operating modes and then make predictions on run-time. Alternately one can also perform actual battery run-down tests which, when performed correctly, yields quite a few more insights beyond representative current drain measurements, such as:
  • Low battery discharge termination details.
  • Battery capacity and energy actually delivered.
  • Actual run time achieved.
  • How well the battery and device work together as a system


An actual battery-run down test is an indispensable part of validation as a final proof of performance.

Just as with evaluating battery run-down, it is also just as important to evaluate battery charging and management. Again, a lot of testing can be done on a device independent of its battery, but there is also a lot of additional value in validating a device’s charge management performance with its actual battery.

When validating a device’s discharging and charging performance with an actual battery, the first test challenge is the current drawn from or sourced to the battery needs to be accurately measured and logged over time, together with the battery’s voltage, for making good capacity and energy measurements. The second test challenge here is you cannot afford to introduce any significant drop in voltage between the device and its battery, as this alters charging and discharging performance of the battery powered device. This can be a real problem when trying to use shunt resistors.

An alternative is to use a zero-burden ammeter. You may ask how an ammeter can be zero-burden. It has to have some resistance in order to produce a measurable value, right? Well, not always. Agilent provides an innovative alternative use of the N6781A 2-quadrant source measure module that enables it to operate as a zero-burden ammeter (in addition to being a DC source). Using the N6781A as a zero-burden ammeter to evaluate battery run-down and battery charging of a battery-powered device is depicted in Figure 1.


Figure 1: N6781A zero-burden ammeter / wattmeter operation

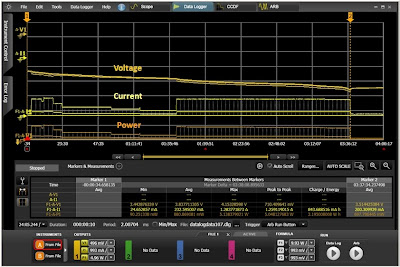
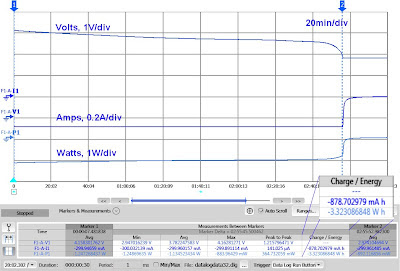
The N6781A is able to operate as a zero-burden ammeter because it is able to actively regulate its output at zero volts independent of the current flowing through it. Because its output is zero volts, when placed in series between the device and its battery, there is no voltage drop. At the same time its precision current measurement system is able to now measure the discharge or charge currents. In addition a separate voltage measurement port allows it to measure the battery voltage, so now you are able to capture the battery’s discharge or charge voltage profile, as well as determine charge in amp-hours and energy in watt-hours, as shown in Figure 2.


Figure 2: Capturing, displaying, and evaluating battery run-down results with 14585A software

A useful reference providing further details on evaluating a device’s battery run-down and charging, and how to configure and use the N6781A as a zero-burden ammeter are available in our application note; “Evaluating Battery Run-Down with the N6781A 2-Quadrant Source Measure Unit and the 14585A Control and Analysis Software” (click here to access).

Monday, July 9, 2012

Validating Battery Capacity for End-use Conditions


In my previous posting “Some Basics on Battery Ratings and Their Validation” I discussed the importance of making certain you are getting the most out of your battery as a key task for optimizing the battery run-time of a mobile battery powered device. You do not want to just rely on what is specified for the battery but you really need to validate it. Indeed, when I did, I found a battery’s capacity to be 12% lower than its rated value. That is a lot of unexpected loss of run-time to try to make up for! On further testing and investigation I indeed confirmed it was the battery and not something I did with inadequate charging or discharging.

Once you get a handle on the battery’s stated ratings, based on recommended charging and discharging conditions, you should then validate the capacity you are able to get under the loading conditions your device subjects the battery to. Most modern mobile battery powered devices draw high peak pulsed, low average current from the battery. Batteries subject to pulsed loading deliver less capacity in comparison to being subjected to the comparable loading that is only DC.  The amount of impact depends on the battery’s design and its ability to handle high peak pulsed loading. Furthermore two different batteries with the same ratings can deliver substantially different results in the end-use application. The bottom line is you need to validate the battery under end-use conditions to assess how much impact it has on the battery’s performance.

Creating end-use operating conditions for devices of course depends on the type of device. In some cases it may be fairly simple but in many cases it can be rather complex. A smart mobile phone, for example, requires a set up that can emulate the wireless network it normally operates in and then place it in a representative active operating state under which to run down the battery. The battery’s run down voltage and current in turn needs to be logged until the battery reaches its proper discharge termination point, in order to assess the amount of capacity it delivers under end-use conditions. An example of such a set up is shown in Figure 1.

Figure 1: End-use battery run down test set up for a mobile phone

As you are trying to assess battery capacity under end-use conditions you will likely want to run trials several times and for different batteries, you will want to control conditions as closely as possible so that you can confidently compare results knowing they were done under comparable test conditions. You also need to be careful about (not) relying on the mobile device’s internal battery management system for end-of-life discharge termination as it is a possible source of error. A technique I resorted to was to record a representative portion of the end-use pulsed current drain drawn by the mobile phone which I then “played back” continuously through our N6781A SMU, acting as an electronic load, to discharge the battery. The N6781A had the required fidelity, accuracy, and “playback” hooks to faithfully reproduce loading of the actual device.  Further details on this record and playback approach are documented in a technical overview “Simplify Validating a Battery’s Capacity and Energy for End-Use Loading Conditions”. The results of my validating the battery’s capacity under end-use conditions are shown in Figure 2.

Figure 2: End-use battery capacity validation results

In this case the battery delivered 3% less capacity under end-use pulsed loading in comparison to the results when validated using comparable DC-only loading. Here the battery appears well suited for its end-use application. Many times however, the impact can be much greater. As always, make certain to take appropriate safety precautions when working with batteries and cells.

Thursday, June 28, 2012

Some Basics on Battery Ratings and Their Validation


A key aspect of optimizing battery run-time on battery powered mobile devices is measuring and analyzing their current drain to gain greater insight on how the device is making use of its battery power and then how to make better use of it. I went into a bit of detail on this in a previous posting, “Using Current Drain Measurements to Optimize Battery Run-time of Mobile Devices”.

A second aspect of optimizing battery run-time is making certain you are making optimum use of the battery powering the device. This starts with understanding and validating the battery’s stated capacity and energy ratings. Simply assuming the battery meets or exceeds its stated ratings without validating them is bound to leave you coming up shorter than expected on run-time.  It is critical that you validate them per the manufacturer’s recommended conditions. This serves as a starting point of finding out what you can ultimately expect from the battery you intend to use in your device. More than likely constraints imposed by the nature of your device and its operating conditions and requirements will further reduce the amount of capacity you can expect from the battery in actual use.

A battery’s capacity rating is the total amount of charge the battery can deliver. It is product of the current it can deliver over time, stated as ampere-hours (Ah) or miiliampere-hours (mAh). Alternately the charge rating is also stated as coulombs (C), where:
·         1 coulomb (C)= 1 ampere-sec
·         1 ampere-hour (Ah)= 3,600 coulombs

A battery’s energy rating is the total amount of energy the battery can deliver. It is the product of the power it can deliver over time, stated as watt-hours (Wh) or milliwatt-hours (mWh). It is also the product of the battery’s capacity (Ah) and voltage (V). Alternately the energy rating is also stated as joules (J) where:
·         1 joule (J)= 1 watt-second
·         1 watt-hour (Wh) = 3,600 joules

One more fundamental parameter relating to a battery’s capacity and energy ratings is the C rate or charge (or discharge) rate. This is the ratio of the level of current being furnished (or drawn from, when discharging) the battery, to the battery’s capacity, where:
·         C rate (C) = current (A) / (capacity (Ah)
·         C rate (C) = 1 / charge or discharge time

It is interesting to note while “C” is used to designate units of C rate, the units are actually 1/h or h-1. The type of battery and its design has a large impact on the battery’s C rate. Batteries for power tools have a high C rate capability of 10C or greater, for example, as they need to deliver high levels of power over short periods of time. More often however is that many batteries used in portable wireless mobile devices need to run for considerably longer and they utilize batteries having relatively low C rates. A battery’s capacity is validated with a C rate considerably lower than it is capable of as when the C rate is increased the capacity drops due to losses within the battery itself.

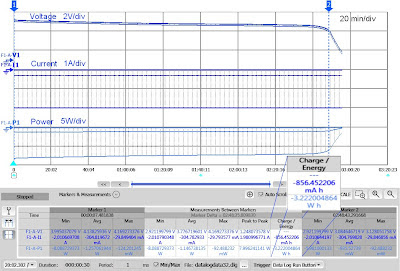
Validating a battery’s capacity and energy ratings requires logging the battery’s voltage and current over an extended period of time, most often with a regulated constant current load. An example of this for a lithium ion cell is shown in Figure 1 below. Capacity was found to be 12% lower than its rating.

Figure 1: Measuring a battery’s capacity and energy

Additional details on this can be found in a technical overview I wrote, titled “Simply Validating a Battery’s Capacity and Energy Ratings”. As always, proper safety precautions always be observed when working with batteries and cells. Validating the battery’s stated capacity and energy ratings is the first step. As the battery is impacted by the device it is powering, it must then be validated under its end-use conditions as well. Stay tuned!